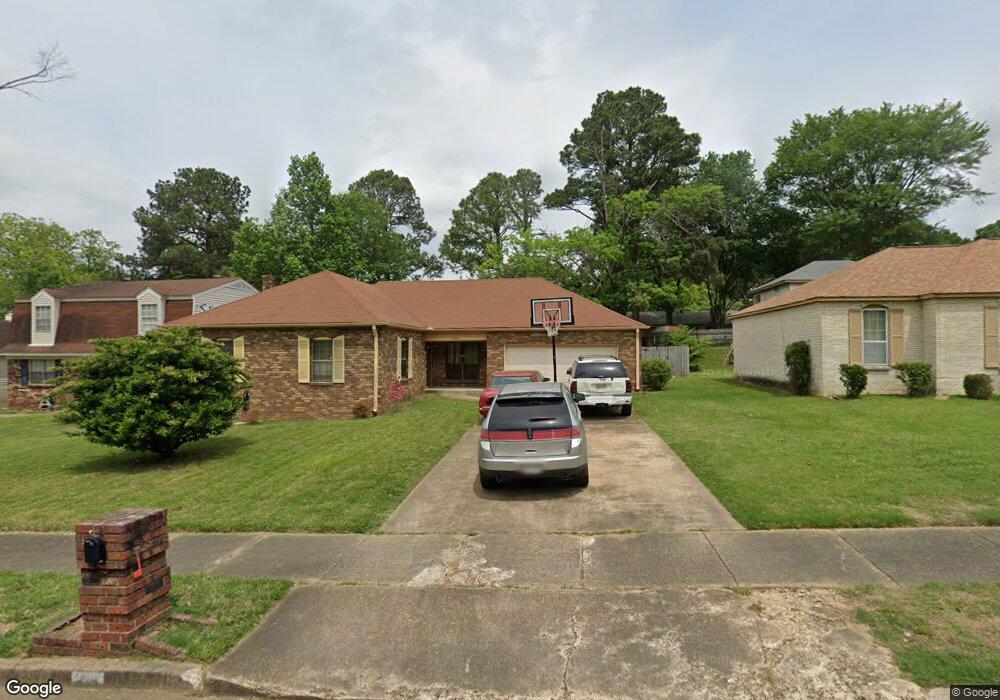
5308 Adney Gap Cove Memphis, TN 38134
Raleigh NeighborhoodEstimated Value: $205,000 - $229,000
3
Beds
2
Baths
1,642
Sq Ft
$135/Sq Ft
Est. Value
About This Home
This home is located at 5308 Adney Gap Cove, Memphis, TN 38134 and is currently estimated at $220,931, approximately $134 per square foot. 5308 Adney Gap Cove is a home located in Shelby County with nearby schools including Shelby Oaks Elementary School, Kingsbury High School, and Kate Bond Middle School.
Ownership History
Date
Name
Owned For
Owner Type
Purchase Details
Closed on
Mar 24, 2022
Sold by
Nicholson Beau Richard
Bought by
Ki & Nicholson Llc
Current Estimated Value
Purchase Details
Closed on
Dec 2, 2020
Sold by
Investor Nationa Llc
Bought by
Nicholson Beau Richard
Home Financials for this Owner
Home Financials are based on the most recent Mortgage that was taken out on this home.
Original Mortgage
$132,000
Interest Rate
2.8%
Mortgage Type
New Conventional
Purchase Details
Closed on
Sep 6, 2020
Sold by
Johnson Nashonda
Bought by
Investor Nation Llc
Purchase Details
Closed on
Dec 12, 1997
Sold by
Casey Erskine A
Bought by
Johnson Nathaniel and Johnson Arminter J
Home Financials for this Owner
Home Financials are based on the most recent Mortgage that was taken out on this home.
Original Mortgage
$48,500
Interest Rate
7.23%
Create a Home Valuation Report for This Property
The Home Valuation Report is an in-depth analysis detailing your home's value as well as a comparison with similar homes in the area
Home Values in the Area
Average Home Value in this Area
Purchase History
| Date | Buyer | Sale Price | Title Company |
|---|---|---|---|
| Ki & Nicholson Llc | -- | None Listed On Document | |
| Ki & Nicholson Llc | -- | Macarthurlieder & Metier Pllc | |
| Nicholson Beau Richard | $165,000 | Haven Title Llc | |
| Investor Nation Llc | $115,000 | None Available | |
| Johnson Nathaniel | $83,500 | Security Title Company Inc |
Source: Public Records
Mortgage History
| Date | Status | Borrower | Loan Amount |
|---|---|---|---|
| Previous Owner | Nicholson Beau Richard | $132,000 | |
| Previous Owner | Johnson Nathaniel | $48,500 |
Source: Public Records
Tax History Compared to Growth
Tax History
| Year | Tax Paid | Tax Assessment Tax Assessment Total Assessment is a certain percentage of the fair market value that is determined by local assessors to be the total taxable value of land and additions on the property. | Land | Improvement |
|---|---|---|---|---|
| 2025 | $1,411 | $56,975 | $6,250 | $50,725 |
| 2024 | $1,411 | $41,625 | $5,000 | $36,625 |
| 2023 | $2,536 | $41,625 | $5,000 | $36,625 |
| 2022 | $1,411 | $41,625 | $5,000 | $36,625 |
| 2021 | $3,014 | $41,625 | $5,000 | $36,625 |
| 2020 | $720 | $22,525 | $5,000 | $17,525 |
| 2019 | $720 | $22,525 | $5,000 | $17,525 |
| 2018 | $720 | $22,525 | $5,000 | $17,525 |
| 2017 | $737 | $22,525 | $5,000 | $17,525 |
| 2016 | $914 | $20,925 | $0 | $0 |
| 2014 | $914 | $20,925 | $0 | $0 |
Source: Public Records
Map
Nearby Homes
- 5292 Pipers Gap Cove
- 5315 Pipers Gap Cove
- 5345 Raleigh Lagrange Rd
- 1970 Adney Gap Dr
- 1962 Adney Gap Dr
- 5433 Pipers Gap Dr
- 5509 Rappahannock Dr
- 5595 Raleigh Lagrange Rd
- 5531 Quail Thicket Dr
- 5105 Pleasant View Rd
- 5616 Falling Bark Dr
- 2093 Penn Gap Cove
- 5577 Falling Bark Dr
- 2373 W Monica Dr
- 2481 Chiswood St
- 1751 Fox Hunt Ln Unit 5
- 2058 Olive Bark Cove
- 2050 Olive Bark Cove
- 5573 Pleasant View Rd Unit 35
- 5554 Massey Station Rd
- 5316 Adney Gap Cove
- 5300 Adney Gap Cove
- 5307 S Rock Ridge Rd
- 5315 S Rock Ridge Rd
- 5301 S Rock Ridge Rd
- 5322 Adney Gap Cove
- 5292 Adney Gap Cove
- 5307 Adney Gap Cove
- 5323 S Rock Ridge Rd
- 5315 Adney Gap Cove
- 5291 S Rock Ridge Rd
- 5301 Adney Gap Cove
- 5332 Adney Gap Cove
- 5283 Adney Gap Cove
- 2067 Adney Gap Dr
- 5291 Adney Gap Cove
- 5331 Rock Ridge Rd S
- 5287 Adney Gap Cove
- 2103 Blue Ridge Cove
- 5310 S Rock Ridge Rd