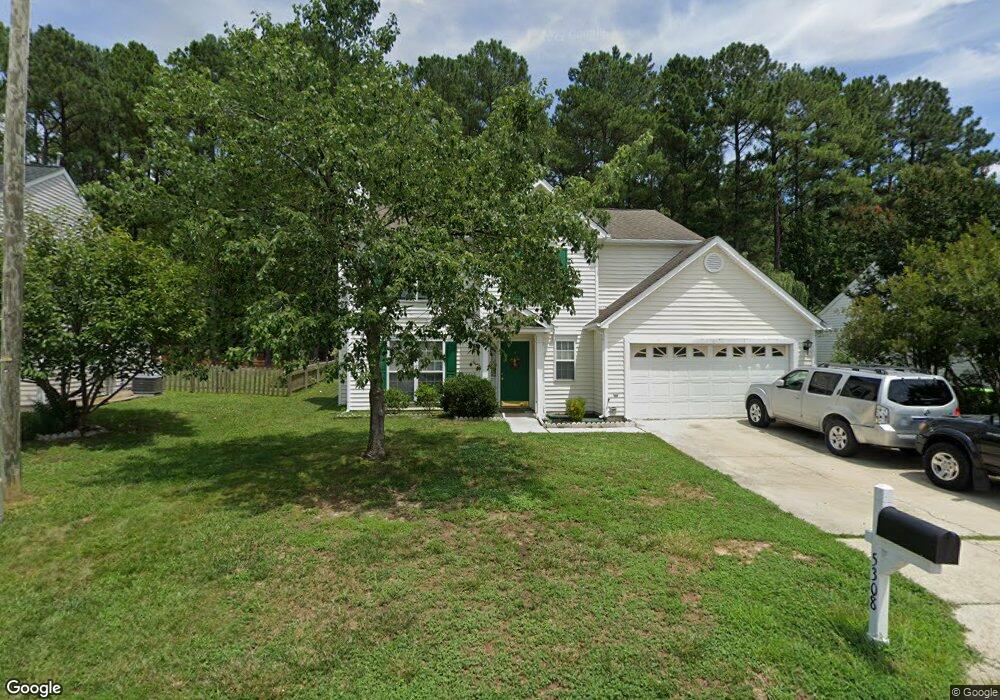
5308 Cardinal Grove Blvd Raleigh, NC 27616
Northeast Raleigh NeighborhoodEstimated Value: $368,000 - $384,000
4
Beds
3
Baths
1,752
Sq Ft
$215/Sq Ft
Est. Value
About This Home
This home is located at 5308 Cardinal Grove Blvd, Raleigh, NC 27616 and is currently estimated at $376,068, approximately $214 per square foot. 5308 Cardinal Grove Blvd is a home located in Wake County with nearby schools including Harris Creek Elementary School, River Bend Middle, and Rolesville High School.
Ownership History
Date
Name
Owned For
Owner Type
Purchase Details
Closed on
Jul 14, 2006
Sold by
Kukela Josee L
Bought by
Medina Merian A and Euceda Agustin Medina
Current Estimated Value
Home Financials for this Owner
Home Financials are based on the most recent Mortgage that was taken out on this home.
Original Mortgage
$32,800
Outstanding Balance
$19,419
Interest Rate
6.6%
Mortgage Type
Stand Alone Second
Estimated Equity
$356,649
Purchase Details
Closed on
May 6, 2006
Sold by
Kukela Simon B
Bought by
Kukela Josee L
Purchase Details
Closed on
Dec 18, 1997
Sold by
Pulte Home Corp
Bought by
Kukela Simon B and Kukela Josee L
Home Financials for this Owner
Home Financials are based on the most recent Mortgage that was taken out on this home.
Original Mortgage
$139,162
Interest Rate
7.26%
Mortgage Type
FHA
Create a Home Valuation Report for This Property
The Home Valuation Report is an in-depth analysis detailing your home's value as well as a comparison with similar homes in the area
Home Values in the Area
Average Home Value in this Area
Purchase History
| Date | Buyer | Sale Price | Title Company |
|---|---|---|---|
| Medina Merian A | $164,000 | None Available | |
| Kukela Josee L | -- | None Available | |
| Kukela Simon B | $142,000 | -- |
Source: Public Records
Mortgage History
| Date | Status | Borrower | Loan Amount |
|---|---|---|---|
| Open | Medina Merian A | $32,800 | |
| Open | Medina Merian A | $131,200 | |
| Previous Owner | Kukela Simon B | $139,162 |
Source: Public Records
Tax History Compared to Growth
Tax History
| Year | Tax Paid | Tax Assessment Tax Assessment Total Assessment is a certain percentage of the fair market value that is determined by local assessors to be the total taxable value of land and additions on the property. | Land | Improvement |
|---|---|---|---|---|
| 2025 | $3,110 | $354,301 | $110,000 | $244,301 |
| 2024 | $3,097 | $354,301 | $110,000 | $244,301 |
| 2023 | $2,540 | $231,232 | $52,000 | $179,232 |
| 2022 | $2,361 | $231,232 | $52,000 | $179,232 |
| 2021 | $2,270 | $231,232 | $52,000 | $179,232 |
| 2020 | $2,229 | $231,232 | $52,000 | $179,232 |
| 2019 | $1,948 | $166,329 | $36,000 | $130,329 |
| 2018 | $1,837 | $166,329 | $36,000 | $130,329 |
| 2017 | $1,750 | $166,329 | $36,000 | $130,329 |
| 2016 | $1,715 | $166,329 | $36,000 | $130,329 |
| 2015 | $1,757 | $167,743 | $36,000 | $131,743 |
| 2014 | $1,667 | $167,743 | $36,000 | $131,743 |
Source: Public Records
Map
Nearby Homes
- 5325 Marthonna Way
- 5012 Silverdene St
- 4800 Arbor Lodge Dr
- 5321 Glass Ridge Rd
- 5915 River Landings Dr
- 4821 Heathshire Dr
- 5208 Windmere Chase Dr
- 6009 River Landings Dr
- 4804 Spring Forest Rd
- 4416 Walker Hallow St
- 6016 River Landings Dr
- 4440 Cardinal Grove Blvd
- 5920 Holly Dr
- 4809 Kaycee Ct
- 4508 Brintons Cottage St
- 4416 Brintons Cottage St
- 4940 Enlightenment Rd
- 6429 Pathfinder Way
- 4348 Karlbrook Ln
- 4252 Rockdell Hall St
- 5304 Cardinal Grove Blvd
- 5312 Cardinal Grove Blvd
- 5300 Cardinal Grove Blvd
- 5500 Waterflower Ct
- 5504 Waterflower Ct
- 5309 Cardinal Grove Blvd
- 5313 Cardinal Grove Blvd
- 5305 Cardinal Grove Blvd
- 5317 Cardinal Grove Blvd
- 5508 Waterflower Ct
- 5301 Cardinal Grove Blvd
- 5220 Cardinal Grove Blvd
- 5312 Carriage Pine Dr
- 5316 Carriage Pine Dr
- 5223 Cardinal Grove Blvd
- 5308 Carriage Pine Dr
- 5320 Carriage Pine Dr
- 5400 Cardinal Grove Blvd
- 5216 Cardinal Grove Blvd
- 5304 Carriage Pine Dr