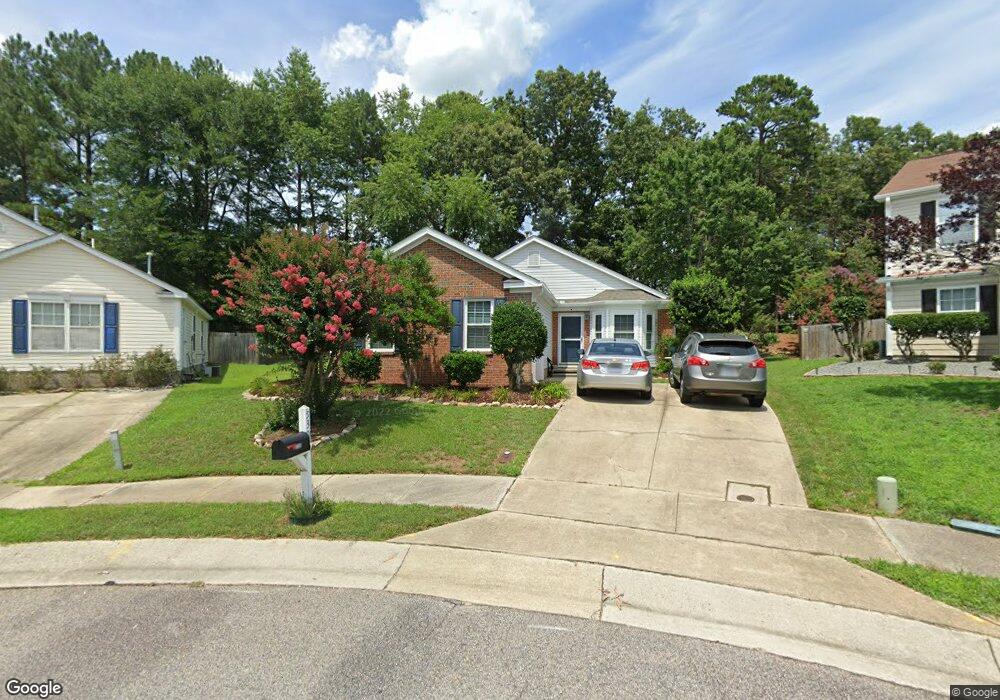
5308 Graymar Ct Raleigh, NC 27616
Northeast Raleigh NeighborhoodEstimated Value: $297,000 - $347,000
3
Beds
2
Baths
1,508
Sq Ft
$218/Sq Ft
Est. Value
About This Home
This home is located at 5308 Graymar Ct, Raleigh, NC 27616 and is currently estimated at $328,386, approximately $217 per square foot. 5308 Graymar Ct is a home located in Wake County with nearby schools including Sanford Creek Elementary School, River Bend Middle, and Rolesville High School.
Ownership History
Date
Name
Owned For
Owner Type
Purchase Details
Closed on
Oct 4, 2017
Sold by
Barnes Ivan W and Barnes Donna M
Bought by
Russeos Revonda Kay and Russeos Nicholas Gus
Current Estimated Value
Purchase Details
Closed on
Apr 15, 2003
Sold by
Barnes Ivan W and Barnes Donna M
Bought by
The Barnes Family Living Trust
Purchase Details
Closed on
Jul 13, 2001
Sold by
Dryden Robert Todd
Bought by
Barnes Ivan W and Barnes Donna M
Home Financials for this Owner
Home Financials are based on the most recent Mortgage that was taken out on this home.
Original Mortgage
$100,800
Interest Rate
7.23%
Purchase Details
Closed on
Sep 4, 1998
Sold by
Beazer Homes Corp
Bought by
Dryden Robert Todd
Home Financials for this Owner
Home Financials are based on the most recent Mortgage that was taken out on this home.
Original Mortgage
$90,700
Interest Rate
6.96%
Create a Home Valuation Report for This Property
The Home Valuation Report is an in-depth analysis detailing your home's value as well as a comparison with similar homes in the area
Home Values in the Area
Average Home Value in this Area
Purchase History
| Date | Buyer | Sale Price | Title Company |
|---|---|---|---|
| Russeos Revonda Kay | $126,000 | None Available | |
| The Barnes Family Living Trust | -- | -- | |
| Barnes Ivan W | $126,000 | -- | |
| Dryden Robert Todd | $113,500 | -- |
Source: Public Records
Mortgage History
| Date | Status | Borrower | Loan Amount |
|---|---|---|---|
| Previous Owner | Barnes Ivan W | $100,800 | |
| Previous Owner | Dryden Robert Todd | $90,700 |
Source: Public Records
Tax History Compared to Growth
Tax History
| Year | Tax Paid | Tax Assessment Tax Assessment Total Assessment is a certain percentage of the fair market value that is determined by local assessors to be the total taxable value of land and additions on the property. | Land | Improvement |
|---|---|---|---|---|
| 2025 | -- | $322,353 | $110,000 | $212,353 |
| 2024 | $2,820 | $322,353 | $110,000 | $212,353 |
| 2023 | $2,033 | $184,686 | $50,000 | $134,686 |
| 2022 | $1,890 | $184,686 | $50,000 | $134,686 |
| 2021 | $1,817 | $184,686 | $50,000 | $134,686 |
| 2020 | $1,784 | $184,686 | $50,000 | $134,686 |
| 2019 | $1,671 | $142,476 | $40,000 | $102,476 |
| 2018 | $1,577 | $142,476 | $40,000 | $102,476 |
| 2017 | $1,502 | $142,476 | $40,000 | $102,476 |
| 2016 | $1,472 | $142,476 | $40,000 | $102,476 |
| 2015 | $1,521 | $144,965 | $36,000 | $108,965 |
| 2014 | $1,443 | $144,965 | $36,000 | $108,965 |
Source: Public Records
Map
Nearby Homes
- 5012 Silverdene St
- 5200 Fieldwood Ct
- 5325 Marthonna Way
- 4800 Arbor Lodge Dr
- 4821 Heathshire Dr
- 4809 Kaycee Ct
- 4804 Spring Forest Rd
- 5208 Windmere Chase Dr
- 4625 Fox Rd
- 4809 Elmhurst Ridge Ct
- 4416 Walker Hallow St
- 4416 Brintons Cottage St
- 4508 Brintons Cottage St
- 5320 Spring Pines Way
- 4721 Mocha Ln
- 4804 Tolley Ct
- 4236 Saubranch Hill St
- 4440 Cardinal Grove Blvd
- 4505 Woodlawn Dr
- 5915 River Landings Dr
- 5308 Gray Mar Ct
- 5304 Graymar Ct
- 5304 Gray Mar Ct
- 5309 Graymar Ct
- 5309 Gray Mar Ct
- 5300 Graymar Ct
- 5104 Eagles Landing Dr
- 5300 Gray Mar Ct
- 5108 Eagles Landing Dr
- 5305 Graymar Ct
- 5305 Gray Mar Ct
- 5100 Eagles Landing Dr
- 5301 Graymar Ct
- 5112 Eagles Landing Dr
- 5301 Gray Mar Ct
- 5630 Marthonna Way
- 5429 Kassia Ln
- 5116 Eagles Landing Dr
- 5430 Kassia Ln
- 5425 Kassia Ln