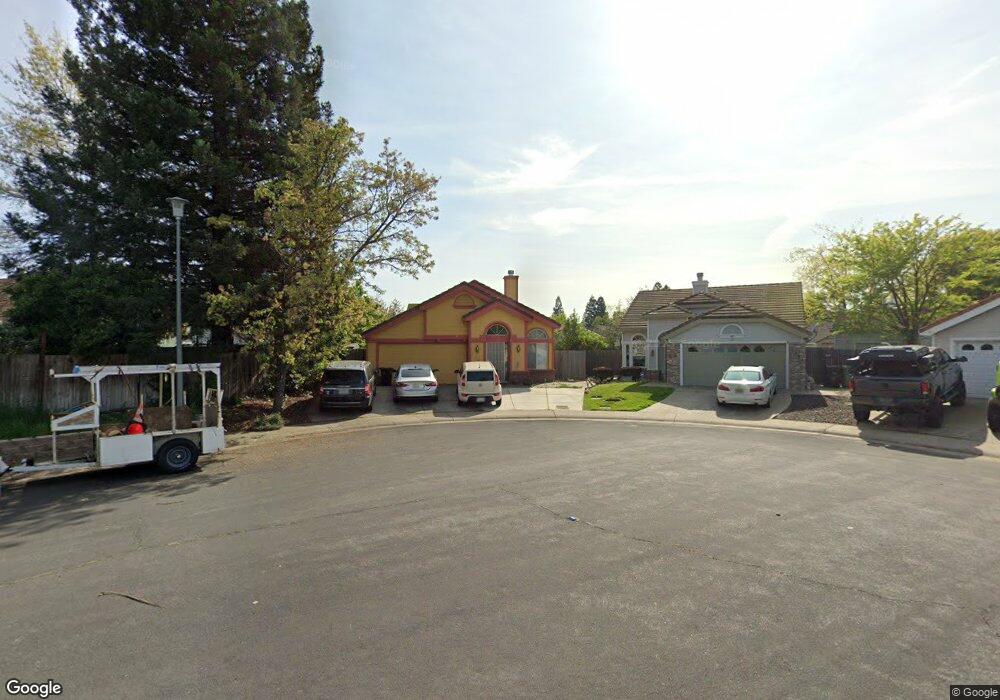
5308 Harvest Moon Ct Elk Grove, CA 95758
North West Elk Grove NeighborhoodEstimated Value: $464,000 - $546,000
3
Beds
2
Baths
1,467
Sq Ft
$348/Sq Ft
Est. Value
About This Home
This home is located at 5308 Harvest Moon Ct, Elk Grove, CA 95758 and is currently estimated at $510,925, approximately $348 per square foot. 5308 Harvest Moon Ct is a home located in Sacramento County with nearby schools including Marion Mix Elementary School, Harriet G. Eddy Middle School, and Laguna Creek High School.
Ownership History
Date
Name
Owned For
Owner Type
Purchase Details
Closed on
Jun 20, 2005
Sold by
Hourigan Michelle M
Bought by
Brown Michael A and Brown Kazuka
Current Estimated Value
Home Financials for this Owner
Home Financials are based on the most recent Mortgage that was taken out on this home.
Original Mortgage
$302,400
Outstanding Balance
$108,384
Interest Rate
1%
Mortgage Type
Negative Amortization
Estimated Equity
$402,541
Purchase Details
Closed on
Nov 6, 2002
Sold by
Hourigan Michelle
Bought by
Hourigan Michelle M
Home Financials for this Owner
Home Financials are based on the most recent Mortgage that was taken out on this home.
Original Mortgage
$160,000
Interest Rate
5.88%
Purchase Details
Closed on
Feb 5, 2002
Sold by
Liu James and Liu Rosie H
Bought by
Hourigan Michelle
Home Financials for this Owner
Home Financials are based on the most recent Mortgage that was taken out on this home.
Original Mortgage
$156,800
Interest Rate
7.13%
Create a Home Valuation Report for This Property
The Home Valuation Report is an in-depth analysis detailing your home's value as well as a comparison with similar homes in the area
Home Values in the Area
Average Home Value in this Area
Purchase History
| Date | Buyer | Sale Price | Title Company |
|---|---|---|---|
| Brown Michael A | $378,000 | Financial Title Company | |
| Hourigan Michelle M | -- | Fidelity National Title Co | |
| Hourigan Michelle | $196,000 | North American Title Co |
Source: Public Records
Mortgage History
| Date | Status | Borrower | Loan Amount |
|---|---|---|---|
| Open | Brown Michael A | $302,400 | |
| Previous Owner | Hourigan Michelle M | $160,000 | |
| Previous Owner | Hourigan Michelle | $156,800 |
Source: Public Records
Tax History Compared to Growth
Tax History
| Year | Tax Paid | Tax Assessment Tax Assessment Total Assessment is a certain percentage of the fair market value that is determined by local assessors to be the total taxable value of land and additions on the property. | Land | Improvement |
|---|---|---|---|---|
| 2025 | $5,893 | $526,881 | $174,230 | $352,651 |
| 2024 | $5,893 | $516,551 | $170,814 | $345,737 |
| 2023 | $5,731 | $506,423 | $167,465 | $338,958 |
| 2022 | $5,633 | $496,494 | $164,182 | $332,312 |
| 2021 | $4,440 | $383,211 | $155,678 | $227,533 |
| 2020 | $3,951 | $339,126 | $137,769 | $201,357 |
| 2019 | $3,709 | $316,942 | $128,757 | $188,185 |
| 2018 | $3,546 | $304,753 | $123,805 | $180,948 |
| 2017 | $3,329 | $284,817 | $115,706 | $169,111 |
| 2016 | $3,017 | $263,721 | $107,136 | $156,585 |
| 2015 | $2,755 | $239,747 | $97,397 | $142,350 |
| 2014 | $2,628 | $226,176 | $91,884 | $134,292 |
Source: Public Records
Map
Nearby Homes
- 5310 Privet Ln
- 8741 Noble Fir Ln
- 4910 Harrow Dr
- 6024 Deepdale Way
- 0 Elliott Ranch Rd Unit 225131105
- 1312 Winterhart St
- 8959 Boreal Way
- 6131 Jacinto Ave
- 5013 Efthemia Way
- 8451 Montpelier Way
- 8944 Warmsprings St
- 8647 Starburst Way
- 6411 Jacinto Ave
- 6411 Jacinto Way
- 6424 Ventris Walk
- 5208 Misty Meadow Way
- 6419 Jacinto Ave
- 6419 Jacinto Way
- Biltmore Plan at Ventris Place
- Carefree Plan at Ventris Place
- 5304 Harvest Moon Ct
- 8732 Clay Glen Way
- 8728 Clay Glen Way
- 5237 Stoney Creek Way
- 5233 Stoney Creek Way
- 5241 Stoney Creek Way
- 8724 Clay Glen Way
- 5300 Harvest Moon Ct
- 5229 Stoney Creek Way
- 5245 Stoney Creek Way
- 8729 Lewie Way
- 8725 Lewie Way
- 5301 Harvest Moon Ct
- 5225 Stoney Creek Way
- 5305 Harvest Moon Ct
- 5309 Harvest Moon Ct
- 8718 Clay Glen Way
- 8721 Lewie Way
- 5313 Harvest Moon Ct
- 8733 Clay Glen Way