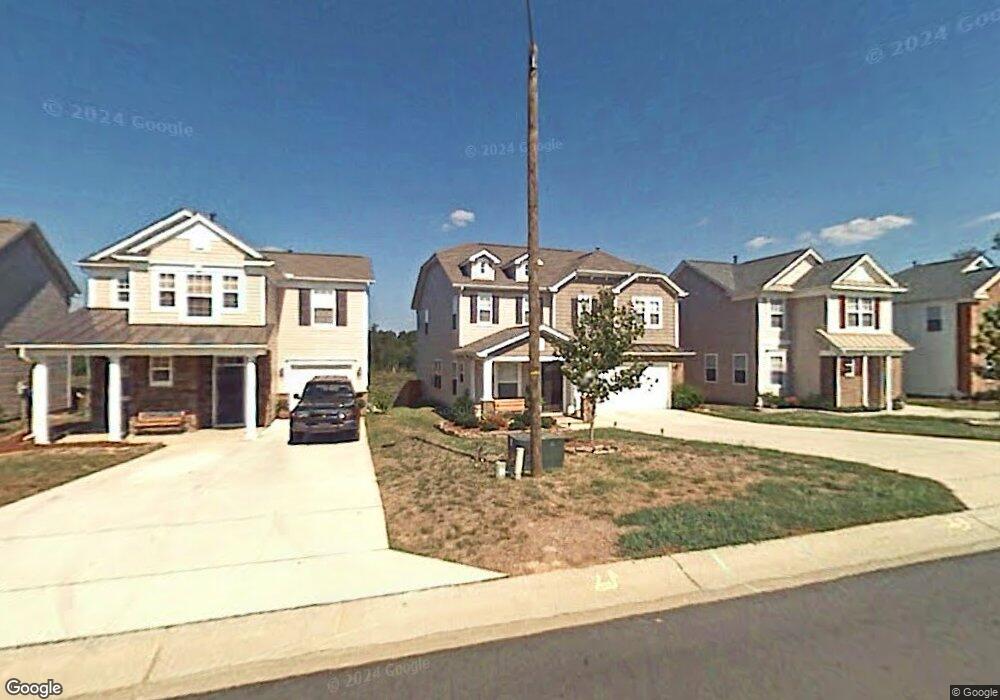
5308 Meryton Park Way Raleigh, NC 27616
Forestville NeighborhoodEstimated Value: $412,000 - $428,000
4
Beds
3
Baths
2,440
Sq Ft
$172/Sq Ft
Est. Value
About This Home
This home is located at 5308 Meryton Park Way, Raleigh, NC 27616 and is currently estimated at $420,844, approximately $172 per square foot. 5308 Meryton Park Way is a home located in Wake County with nearby schools including Wildwood Forest Elementary, East Millbrook Middle, and Wakefield High School.
Ownership History
Date
Name
Owned For
Owner Type
Purchase Details
Closed on
Dec 11, 2019
Sold by
Zhang Zhen and Zhang Zhigang
Bought by
Vaquiz Jose David Blanco
Current Estimated Value
Home Financials for this Owner
Home Financials are based on the most recent Mortgage that was taken out on this home.
Original Mortgage
$193,000
Outstanding Balance
$170,490
Interest Rate
3.7%
Mortgage Type
New Conventional
Estimated Equity
$250,354
Purchase Details
Closed on
Apr 18, 2018
Sold by
Irabor Christopher Imobighe and Irabor Ramona Stallings
Bought by
Zhang Zhen
Purchase Details
Closed on
May 31, 2005
Sold by
Kb Home Raleigh Durham Llc
Bought by
Irabor Christopher and Irabor Ramona
Home Financials for this Owner
Home Financials are based on the most recent Mortgage that was taken out on this home.
Original Mortgage
$165,150
Interest Rate
5.37%
Mortgage Type
Fannie Mae Freddie Mac
Purchase Details
Closed on
Sep 28, 2004
Sold by
Thorton Ventures Llc
Bought by
Kb Home Raleigh Durham Llc
Create a Home Valuation Report for This Property
The Home Valuation Report is an in-depth analysis detailing your home's value as well as a comparison with similar homes in the area
Home Values in the Area
Average Home Value in this Area
Purchase History
| Date | Buyer | Sale Price | Title Company |
|---|---|---|---|
| Vaquiz Jose David Blanco | $263,000 | None Available | |
| Zhang Zhen | $245,000 | None Available | |
| Irabor Christopher | $206,500 | -- | |
| Kb Home Raleigh Durham Llc | $1,089,000 | -- |
Source: Public Records
Mortgage History
| Date | Status | Borrower | Loan Amount |
|---|---|---|---|
| Open | Vaquiz Jose David Blanco | $193,000 | |
| Previous Owner | Irabor Christopher | $165,150 | |
| Previous Owner | Irabor Christopher | $30,966 |
Source: Public Records
Tax History Compared to Growth
Tax History
| Year | Tax Paid | Tax Assessment Tax Assessment Total Assessment is a certain percentage of the fair market value that is determined by local assessors to be the total taxable value of land and additions on the property. | Land | Improvement |
|---|---|---|---|---|
| 2025 | $3,717 | $423,907 | $80,000 | $343,907 |
| 2024 | $3,702 | $423,907 | $80,000 | $343,907 |
| 2023 | $2,710 | $246,797 | $42,000 | $204,797 |
| 2022 | $2,519 | $246,797 | $42,000 | $204,797 |
| 2021 | $2,421 | $246,797 | $42,000 | $204,797 |
| 2020 | $2,377 | $246,797 | $42,000 | $204,797 |
| 2019 | $2,386 | $204,130 | $30,000 | $174,130 |
| 2018 | $0 | $204,130 | $30,000 | $174,130 |
| 2017 | $2,144 | $204,130 | $30,000 | $174,130 |
| 2016 | $2,100 | $204,130 | $30,000 | $174,130 |
| 2015 | $2,294 | $219,558 | $36,000 | $183,558 |
| 2014 | -- | $219,558 | $36,000 | $183,558 |
Source: Public Records
Map
Nearby Homes
- 5126 Thornton Knoll Way
- 8911 Elizabeth Benneth Place
- SYDNEY Plan at Thornton Townes
- JONATHAN Plan at Thornton Townes
- 8857 Thornton Town Place
- 5163 Sandy Banks Rd
- 5107 Sandy Banks Rd
- 5121 Neuse Commons Ln
- 8947 Commons Townes Dr
- 8640 Neuse Landing Ln Unit 110
- 8957 Commons Townes Dr
- 8707 River Keeper Way
- 8610 Neuse Landing Ln Unit 103
- 8702 Neuse Town Dr
- 8620 Neuse Club Ln Unit 111
- 8620 Neuse Club Ln Unit 107
- 8885 Commons Townes Dr
- 8537 Beckett Chase Way
- 8535 Beckett Chase Way
- 8529 Beckett Chase Way
- 5308 Meryton Pkwy
- 5312 Meryton Park Way
- 5304 Meryton Park Way
- 5304 Meryton Pkwy
- 5312 Meryton Pkwy
- 5316 Meryton Park Way
- 5316 Meryton Pkwy
- 5300 Meryton Park Way
- 5300 Meryton Pkwy
- 5320 Meryton Pkwy
- 5249 Meryton Pkwy
- 5249 Meryton Park Way
- 5254 Meryton Pkwy
- 5254 Meryton Park Way
- 5324 Meryton Pkwy
- 5241 Meryton Park Way
- 5241 Meryton Pkwy
- 5324 Meryton Park Way
- 5317 Meryton Park Way
- 5250 Meryton Pkwy