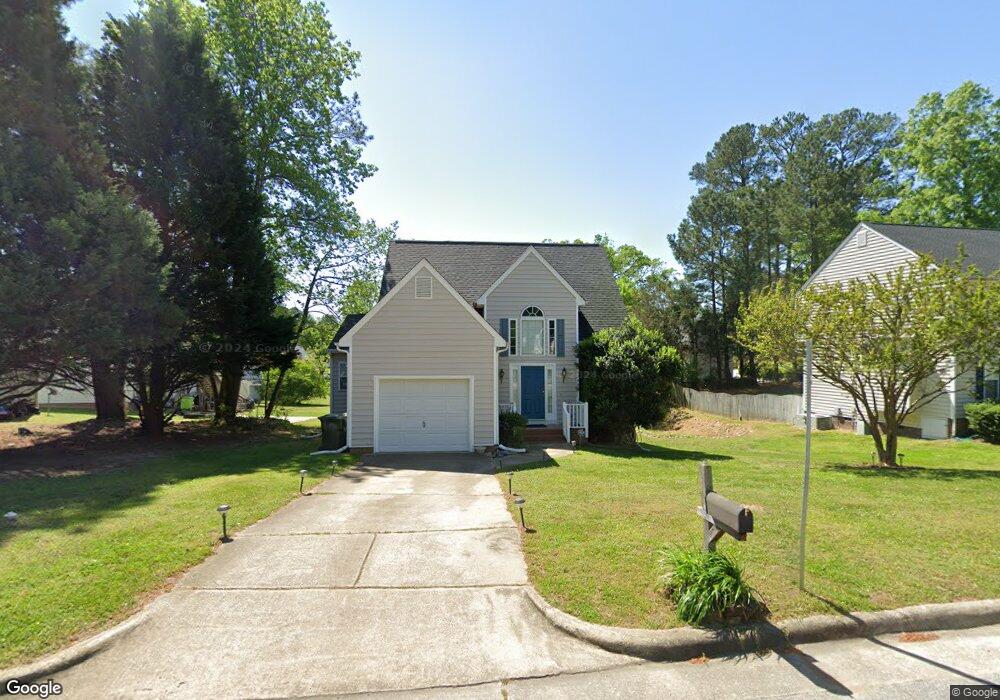
5308 Neuse Ridge Rd Raleigh, NC 27610
Southeast Raleigh NeighborhoodEstimated Value: $359,230 - $367,000
3
Beds
3
Baths
1,760
Sq Ft
$206/Sq Ft
Est. Value
About This Home
This home is located at 5308 Neuse Ridge Rd, Raleigh, NC 27610 and is currently estimated at $362,308, approximately $205 per square foot. 5308 Neuse Ridge Rd is a home located in Wake County with nearby schools including Rogers Lane Elementary, River Bend Middle, and Southeast Raleigh Magnet High School.
Ownership History
Date
Name
Owned For
Owner Type
Purchase Details
Closed on
May 20, 2002
Sold by
Brinkley Sejal
Bought by
Brinkley Marcus
Current Estimated Value
Purchase Details
Closed on
Jul 31, 1998
Sold by
Capitol Homes Inc
Bought by
Brinkley Marcus and Brinkley Sejal K
Home Financials for this Owner
Home Financials are based on the most recent Mortgage that was taken out on this home.
Original Mortgage
$142,144
Outstanding Balance
$29,706
Interest Rate
6.94%
Mortgage Type
FHA
Estimated Equity
$332,602
Purchase Details
Closed on
Apr 3, 1998
Sold by
Amerimann Partners Ii Llc
Bought by
Capitol Homes Inc
Home Financials for this Owner
Home Financials are based on the most recent Mortgage that was taken out on this home.
Original Mortgage
$23,000
Interest Rate
7.06%
Create a Home Valuation Report for This Property
The Home Valuation Report is an in-depth analysis detailing your home's value as well as a comparison with similar homes in the area
Home Values in the Area
Average Home Value in this Area
Purchase History
| Date | Buyer | Sale Price | Title Company |
|---|---|---|---|
| Brinkley Marcus | $2,000 | -- | |
| Brinkley Marcus | $147,000 | -- | |
| Capitol Homes Inc | $24,000 | -- |
Source: Public Records
Mortgage History
| Date | Status | Borrower | Loan Amount |
|---|---|---|---|
| Open | Brinkley Marcus | $142,144 | |
| Previous Owner | Capitol Homes Inc | $23,000 |
Source: Public Records
Tax History Compared to Growth
Tax History
| Year | Tax Paid | Tax Assessment Tax Assessment Total Assessment is a certain percentage of the fair market value that is determined by local assessors to be the total taxable value of land and additions on the property. | Land | Improvement |
|---|---|---|---|---|
| 2025 | $3,375 | $384,697 | $75,000 | $309,697 |
| 2024 | $3,361 | $384,697 | $75,000 | $309,697 |
| 2023 | $2,293 | $208,488 | $34,000 | $174,488 |
| 2022 | $2,131 | $208,488 | $34,000 | $174,488 |
| 2021 | $2,049 | $208,488 | $34,000 | $174,488 |
| 2020 | $2,011 | $208,488 | $34,000 | $174,488 |
| 2019 | $1,753 | $149,513 | $30,000 | $119,513 |
| 2018 | $1,654 | $149,513 | $30,000 | $119,513 |
| 2017 | $1,575 | $149,513 | $30,000 | $119,513 |
| 2016 | -- | $149,513 | $30,000 | $119,513 |
| 2015 | $1,671 | $159,450 | $32,000 | $127,450 |
| 2014 | $1,585 | $159,450 | $32,000 | $127,450 |
Source: Public Records
Map
Nearby Homes
- 5430 Neuse Ridge Rd
- 108 Penncross Dr
- 5310 Heather Ridge Ln
- 320 Gilman Ln Unit 110
- 320 Gilman Ln Unit 106
- 501 Dandelion Ct
- 300 Gilman Ln Unit 101
- 5512 Pennfine Dr
- 5204 Bentgrass Dr
- 5011 Peachtree Town Ln
- 75 Wellington Dr
- 1002 Meridian View Ct
- 5800 Brookshadow Dr
- 1004 Dogwood Bloom Ln
- 5236 Turf Grass Ct
- 801 Falling Wind Ct
- 804 Falling Wind Ct
- 413 Hanska Way
- 821 White Daisies Ct
- 900 Reflection Ct
- 5304 Neuse Ridge Rd
- 249 Cross Current Ln
- 245 Cross Current Ln
- 5300 Neuse Ridge Rd
- 5313 Neuse Ridge Rd
- 5309 Neuse Ridge Rd
- 241 Cross Current Ln
- 200 Anderson Point Dr
- 5317 Neuse Ridge Rd
- 5305 Neuse Ridge Rd
- 5321 Neuse Ridge Rd
- 5301 Neuse Ridge Rd
- 248 Cross Current Ln
- 240 Cross Current Ln
- 237 Cross Current Ln
- 5401 Neuse Ridge Rd
- 115 Anderson Point Dr
- 5409 Neuse View Dr
- 5405 Neuse View Dr
- 5308 Robbins Dr