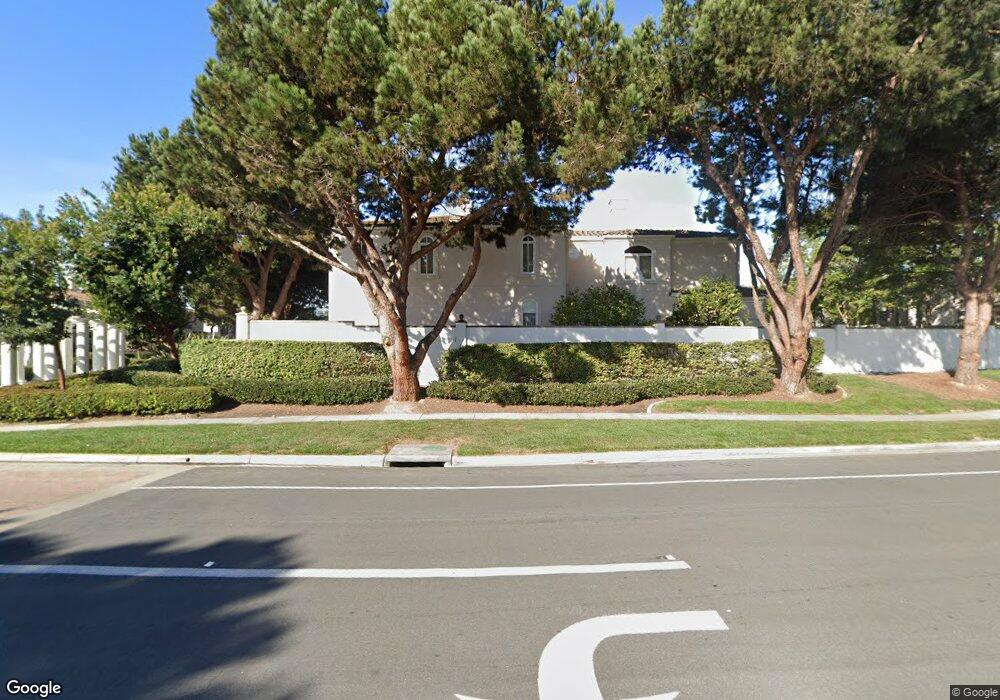
5308 Renaissance Ave Unit 3 San Diego, CA 92122
University City NeighborhoodEstimated Value: $1,506,000 - $1,708,000
3
Beds
3
Baths
2,429
Sq Ft
$656/Sq Ft
Est. Value
About This Home
This home is located at 5308 Renaissance Ave Unit 3, San Diego, CA 92122 and is currently estimated at $1,592,922, approximately $655 per square foot. 5308 Renaissance Ave Unit 3 is a home located in San Diego County with nearby schools including Spreckels Elementary School, Standley Middle School, and University City High School.
Ownership History
Date
Name
Owned For
Owner Type
Purchase Details
Closed on
Jan 26, 2024
Sold by
Schaer Marsha Lee
Bought by
Marsha Lee Schaer Revocable Trust and Schaer
Current Estimated Value
Purchase Details
Closed on
Feb 26, 2021
Sold by
Schaer Marsha Lee
Bought by
Schaer Marsha Lee
Purchase Details
Closed on
May 8, 1995
Sold by
Myers Newton M and Myers Dolly M
Bought by
Myers Newton M and Myers Dolly M
Purchase Details
Closed on
Jul 14, 1994
Sold by
Davidson Coscan Partners
Bought by
Myers Newton M and Myers Dolly M
Home Financials for this Owner
Home Financials are based on the most recent Mortgage that was taken out on this home.
Original Mortgage
$267,900
Interest Rate
4.5%
Mortgage Type
Purchase Money Mortgage
Create a Home Valuation Report for This Property
The Home Valuation Report is an in-depth analysis detailing your home's value as well as a comparison with similar homes in the area
Home Values in the Area
Average Home Value in this Area
Purchase History
| Date | Buyer | Sale Price | Title Company |
|---|---|---|---|
| Marsha Lee Schaer Revocable Trust | -- | None Listed On Document | |
| Schaer Marsha Lee | -- | None Available | |
| Myers Newton M | -- | -- | |
| Myers Newton M | $335,000 | First American Title |
Source: Public Records
Mortgage History
| Date | Status | Borrower | Loan Amount |
|---|---|---|---|
| Previous Owner | Myers Newton M | $267,900 |
Source: Public Records
Tax History Compared to Growth
Tax History
| Year | Tax Paid | Tax Assessment Tax Assessment Total Assessment is a certain percentage of the fair market value that is determined by local assessors to be the total taxable value of land and additions on the property. | Land | Improvement |
|---|---|---|---|---|
| 2025 | $14,047 | $1,163,613 | $811,824 | $351,789 |
| 2024 | $14,047 | $1,140,798 | $795,906 | $344,892 |
| 2023 | $13,737 | $1,118,430 | $780,300 | $338,130 |
| 2022 | $13,372 | $1,096,500 | $765,000 | $331,500 |
| 2021 | $13,281 | $1,075,000 | $750,000 | $325,000 |
| 2020 | $6,274 | $514,343 | $168,937 | $345,406 |
| 2019 | $6,161 | $504,259 | $165,625 | $338,634 |
| 2018 | $5,759 | $494,373 | $162,378 | $331,995 |
| 2017 | $5,621 | $484,681 | $159,195 | $325,486 |
| 2016 | $5,530 | $475,178 | $156,074 | $319,104 |
| 2015 | $5,447 | $468,041 | $153,730 | $314,311 |
| 2014 | $5,360 | $458,874 | $150,719 | $308,155 |
Source: Public Records
Map
Nearby Homes
- 5310 Renaissance Ave Unit 4
- 7285 Calabria Ct Unit 18
- 7132 Calabria Ct
- 7224 Shoreline Dr Unit 172
- 4452 Via Amable Unit 67
- 4435 Nobel Dr Unit 19
- 8278 Avenida Navidad Unit 3
- 4383 Nobel Dr Unit 88
- 7160 Shoreline Dr Unit 4213
- 7190 Shoreline Dr Unit 6313
- 7915 Camino Kiosco
- 8090 Camino Kiosco
- 7986 Camino Jonata
- 4495 Cather Ave
- 4282 Robbins St
- 9237 Regents Rd Unit K101
- 4627 Huggins St
- 7833 Camino Huerta
- 4055 Crystal Dawn Ln Unit 202
- 4165 Executive Dr Unit F107
- 5340 Renaissance Ave Unit 69
- 5342 Renaissance Ave
- 5344 Renaissance Ave
- 5346 Renaissance Ave Unit 66
- 5350 Renaissance Ave
- 5352 Renaissance Ave
- 5428 Renaissance Ave Unit 59
- 5424 Renaissance Ave
- 5402 Renaissance Ave
- 5414 Renaissance Ave
- 5420 Renaissance Ave
- 5446 Renaissance Ave
- 5452 Renaissance Ave
- 5454 Renaissance Ave
- 5332 Renaissance Ave Unit 72
- 5370 Renaissance Ave
- 5362 Renaissance Ave
- 5316 Renaissance Ave Unit 7
- 5472 Renaissance Ave
- 5478 Renaissance Ave