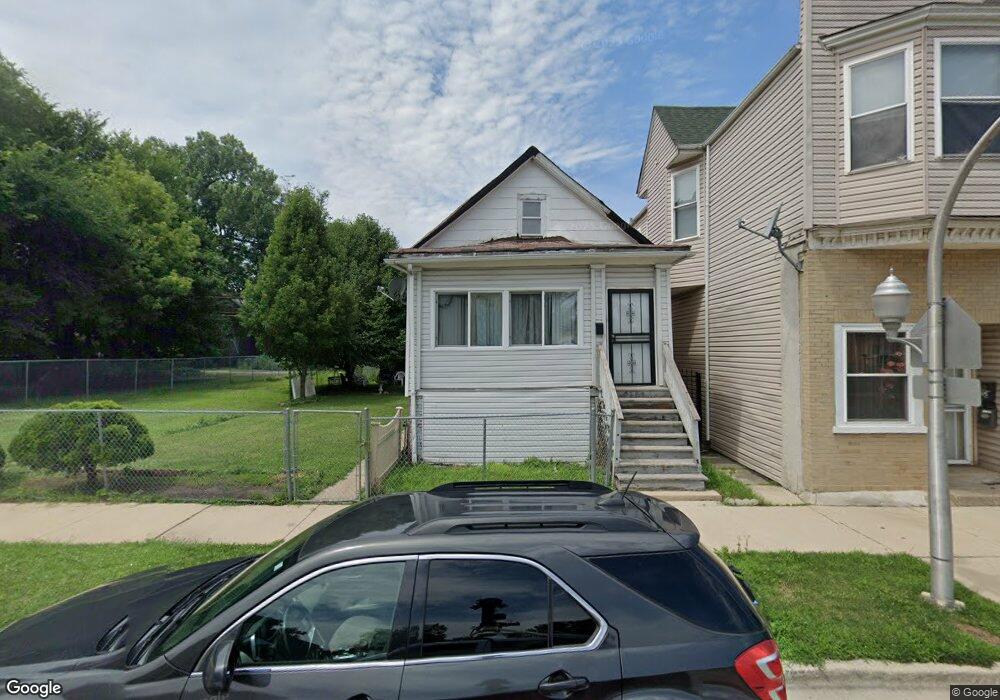
5308 S Union Ave Chicago, IL 60609
Back of the Yards NeighborhoodEstimated Value: $93,493 - $169,000
3
Beds
1
Bath
888
Sq Ft
$148/Sq Ft
Est. Value
About This Home
This home is located at 5308 S Union Ave, Chicago, IL 60609 and is currently estimated at $131,123, approximately $147 per square foot. 5308 S Union Ave is a home located in Cook County with nearby schools including Dewey Elementary Academy Of Fine Arts, KIPP Bloom Charter Elementary School, and Visitation Catholic School.
Ownership History
Date
Name
Owned For
Owner Type
Purchase Details
Closed on
Sep 27, 2004
Sold by
Xez Inc
Bought by
Elder Oscie L
Current Estimated Value
Home Financials for this Owner
Home Financials are based on the most recent Mortgage that was taken out on this home.
Original Mortgage
$64,800
Outstanding Balance
$35,721
Interest Rate
7.95%
Mortgage Type
Unknown
Estimated Equity
$95,402
Purchase Details
Closed on
Nov 12, 2003
Sold by
Capital Tax Corp
Bought by
Xez Inc
Purchase Details
Closed on
Mar 11, 2003
Sold by
Bankers Trust Co Of California Na
Bought by
Capital Tax Corp
Purchase Details
Closed on
Nov 26, 2002
Sold by
Wrightsell Katherine and Gill Floyd
Bought by
Bankers Trust Company Of California Na
Purchase Details
Closed on
Oct 12, 1999
Sold by
Gill Floyd
Bought by
Gill Floyd and Wrightsell Katherine
Home Financials for this Owner
Home Financials are based on the most recent Mortgage that was taken out on this home.
Original Mortgage
$52,700
Interest Rate
7.87%
Create a Home Valuation Report for This Property
The Home Valuation Report is an in-depth analysis detailing your home's value as well as a comparison with similar homes in the area
Home Values in the Area
Average Home Value in this Area
Purchase History
| Date | Buyer | Sale Price | Title Company |
|---|---|---|---|
| Elder Oscie L | $72,000 | -- | |
| Xez Inc | $31,000 | -- | |
| Capital Tax Corp | $24,000 | -- | |
| Bankers Trust Company Of California Na | -- | -- | |
| Gill Floyd | -- | -- |
Source: Public Records
Mortgage History
| Date | Status | Borrower | Loan Amount |
|---|---|---|---|
| Open | Elder Oscie L | $64,800 | |
| Previous Owner | Gill Floyd | $52,700 |
Source: Public Records
Tax History
| Year | Tax Paid | Tax Assessment Tax Assessment Total Assessment is a certain percentage of the fair market value that is determined by local assessors to be the total taxable value of land and additions on the property. | Land | Improvement |
|---|---|---|---|---|
| 2025 | -- | $5,600 | $945 | $4,655 |
| 2024 | -- | $5,600 | $945 | $4,655 |
| 2023 | -- | $3,675 | $2,048 | $1,627 |
| 2022 | $0 | $3,675 | $2,048 | $1,627 |
| 2021 | $1,149 | $3,674 | $2,047 | $1,627 |
| 2020 | $1,149 | $10,740 | $2,047 | $8,693 |
| 2019 | $1,158 | $11,934 | $2,047 | $9,887 |
| 2018 | $1,679 | $11,934 | $2,047 | $9,887 |
| 2017 | $1,114 | $8,551 | $1,890 | $6,661 |
| 2016 | $1,213 | $8,551 | $1,890 | $6,661 |
| 2015 | $1,086 | $8,551 | $1,890 | $6,661 |
| 2014 | $862 | $7,215 | $1,732 | $5,483 |
| 2013 | $834 | $7,215 | $1,732 | $5,483 |
Source: Public Records
Map
Nearby Homes
- 5330 S Union Ave
- 5315 S Lowe Ave
- 5219 S Halsted St
- 5215 S Halsted St
- 643 W 54th Place
- 641 W 54th Place
- 817 W 54th St
- 5129 S Emerald Ave
- 848 W 53rd St
- 652 W Garfield Blvd
- 5300 S Peoria St
- 5302 S Peoria St
- 738 W 51st St
- 5242 S Sangamon St
- 5346 S Morgan St
- 5624 S Lowe Ave
- 949 W 51st St
- 5320 S Carpenter St
- 5610 S Peoria St
- 5419 S Aberdeen St
- 5306 S Union Ave Unit 1
- 5306 S Union Ave
- 5306 S Union Ave Unit 2
- 5303 S Emerald Ave
- 5324 S Union Ave
- 5317 S Emerald Ave
- 5317 S Emerald Ave
- 5301 S Emerald Ave
- 5309 S Emerald Ave
- 5309 S Emerald Ave
- 5319 S Emerald Ave
- 5307 S Emerald Ave Unit 2
- 5258 S Union Ave
- 5305 S Emerald Ave
- 5311 S Emerald Ave
- 5323 S Emerald Ave
- 5323 S Emerald Ave Unit 2R
- 5323 S Emerald Ave
- 5317 S Union Ave
- 5328 S Union Ave