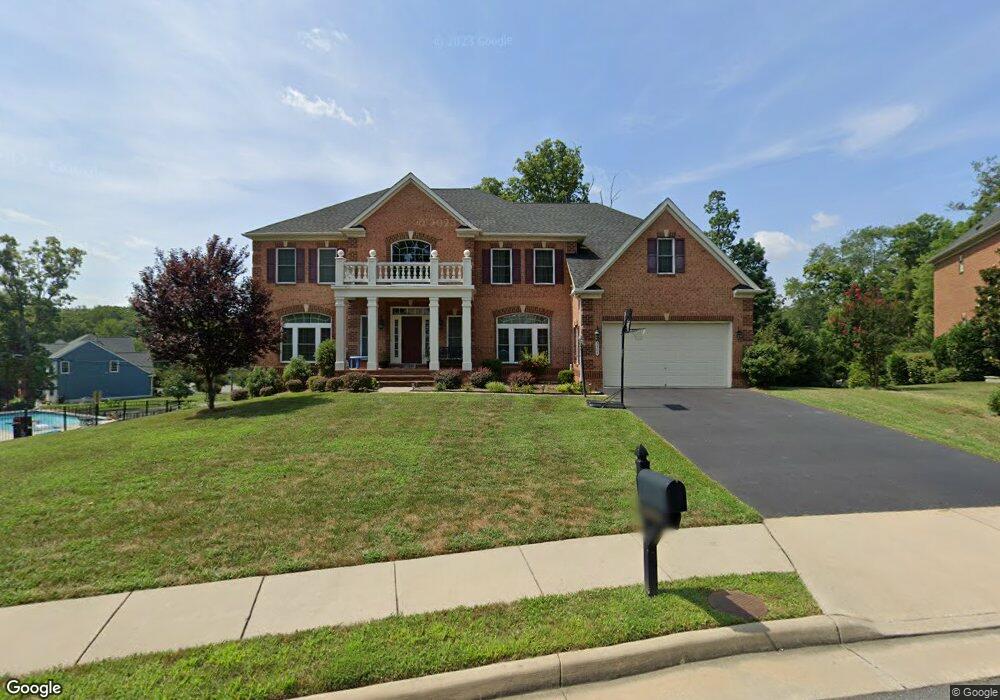
5308 Woodland Estates Way Springfield, VA 22151
Estimated Value: $1,661,000 - $1,871,000
4
Beds
6
Baths
5,909
Sq Ft
$292/Sq Ft
Est. Value
About This Home
This home is located at 5308 Woodland Estates Way, Springfield, VA 22151 and is currently estimated at $1,725,718, approximately $292 per square foot. 5308 Woodland Estates Way is a home located in Fairfax County with nearby schools including North Springfield Elementary School, Holmes Middle School, and Annandale High School.
Ownership History
Date
Name
Owned For
Owner Type
Purchase Details
Closed on
Sep 15, 2017
Sold by
Tran Buu Quang and Tran Nha My Quang
Bought by
Tran Nha My Quang
Current Estimated Value
Home Financials for this Owner
Home Financials are based on the most recent Mortgage that was taken out on this home.
Original Mortgage
$600,000
Outstanding Balance
$501,043
Interest Rate
3.9%
Mortgage Type
New Conventional
Estimated Equity
$1,224,675
Purchase Details
Closed on
Jun 29, 2011
Sold by
Nvr Inc
Bought by
Tran Buu Q
Home Financials for this Owner
Home Financials are based on the most recent Mortgage that was taken out on this home.
Original Mortgage
$550,000
Interest Rate
4.62%
Mortgage Type
New Conventional
Purchase Details
Closed on
Nov 24, 2010
Sold by
Grand Woodland Estates Llc
Bought by
Nvr Inc
Create a Home Valuation Report for This Property
The Home Valuation Report is an in-depth analysis detailing your home's value as well as a comparison with similar homes in the area
Home Values in the Area
Average Home Value in this Area
Purchase History
| Date | Buyer | Sale Price | Title Company |
|---|---|---|---|
| Tran Nha My Quang | -- | Premium Title Services | |
| Tran Buu Q | $1,054,502 | -- | |
| Nvr Inc | $450,000 | -- |
Source: Public Records
Mortgage History
| Date | Status | Borrower | Loan Amount |
|---|---|---|---|
| Open | Tran Nha My Quang | $600,000 | |
| Previous Owner | Tran Buu Q | $550,000 |
Source: Public Records
Tax History Compared to Growth
Tax History
| Year | Tax Paid | Tax Assessment Tax Assessment Total Assessment is a certain percentage of the fair market value that is determined by local assessors to be the total taxable value of land and additions on the property. | Land | Improvement |
|---|---|---|---|---|
| 2025 | $16,633 | $1,500,110 | $355,000 | $1,145,110 |
| 2024 | $16,633 | $1,435,720 | $355,000 | $1,080,720 |
| 2023 | $14,958 | $1,325,440 | $345,000 | $980,440 |
| 2022 | $13,843 | $1,210,590 | $325,000 | $885,590 |
| 2021 | $13,549 | $1,154,550 | $290,000 | $864,550 |
| 2020 | $13,177 | $1,113,380 | $290,000 | $823,380 |
| 2019 | $13,106 | $1,107,380 | $284,000 | $823,380 |
| 2018 | $12,735 | $1,107,380 | $284,000 | $823,380 |
| 2017 | $12,857 | $1,107,380 | $284,000 | $823,380 |
| 2016 | $12,667 | $1,093,380 | $270,000 | $823,380 |
| 2015 | $12,202 | $1,093,380 | $270,000 | $823,380 |
| 2014 | $11,351 | $1,019,440 | $259,000 | $760,440 |
Source: Public Records
Map
Nearby Homes
- 7039 Leestone St
- 5301 Ferndale St
- 5206 Easton Dr
- 5206 Ferndale St
- 7314 Inzer St
- 5227 Cather Rd
- 7419 Farnum St
- 5025 Kingston Dr
- 7228 Evanston Rd
- 7313 Byrneley Ln
- 7118 Kerr Dr
- 7405 Shenandoah Ave
- 5215 Gilpin Dr
- 7457 Long Pine Dr
- 5808 Ash Dr
- 6603 Independence Ave
- 7520 Murillo St
- 7212 Highland St
- 4783 Kandel Ct
- 7230 Beverly St
- 7100 Woodland Estates Way
- 5306 Woodland Estates Way
- 5310 Woodland Estates Way
- 7112 Woodland Dr
- 5307 Woodland Estates Way
- 5307 Woodland Estates Way
- 5304 Woodland Estates Way
- 5401 Backlick Woods Ct
- 5400 Meadwood Forest Ct
- 7116 Woodland Dr
- 5305 Woodland Estates Way
- 5400 Backlick Woods Ct
- 7117 Woodland Dr
- 5302 Woodland Estates Way
- 5403 Backlick Woods Ct
- 5404 Meadwood Forest Ct
- 7105 Triad Way
- 7024 Woodland Dr
- 6990 Meadowforest Ct
- 7118 Woodland Dr