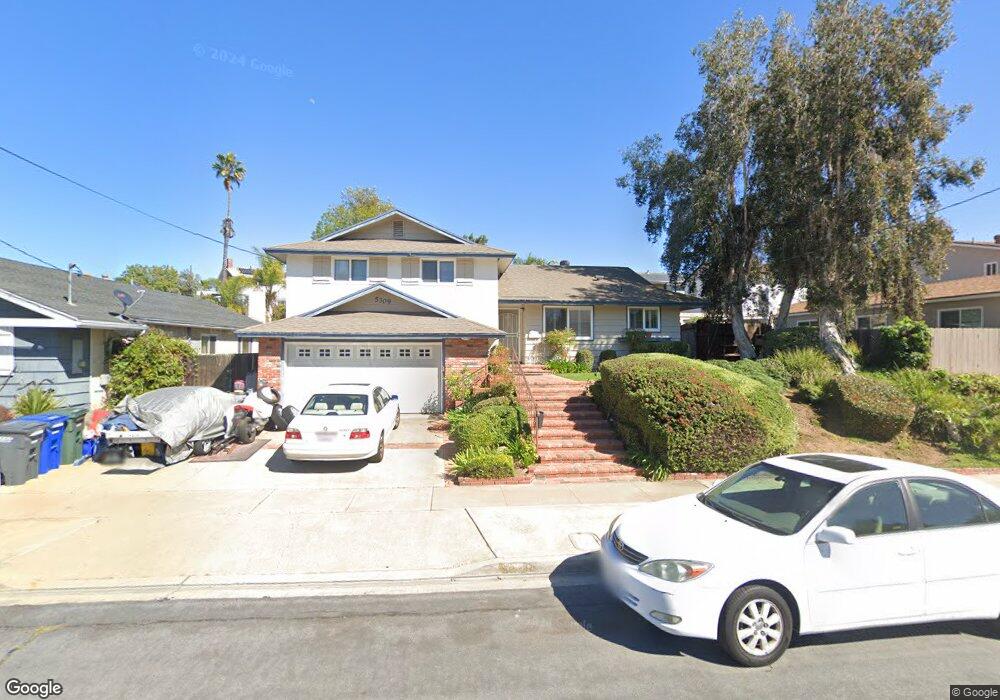
5309 Tufts St La Mesa, CA 91942
Estimated Value: $861,000 - $1,307,000
3
Beds
3
Baths
1,610
Sq Ft
$633/Sq Ft
Est. Value
About This Home
This home is located at 5309 Tufts St, La Mesa, CA 91942 and is currently estimated at $1,019,814, approximately $633 per square foot. 5309 Tufts St is a home located in San Diego County with nearby schools including Maryland Avenue Elementary School, Parkway Academy, and Grossmont High School.
Ownership History
Date
Name
Owned For
Owner Type
Purchase Details
Closed on
Sep 25, 2018
Sold by
Roth Barry M and Barry Roth Living Trust
Bought by
Roth Barry M
Current Estimated Value
Purchase Details
Closed on
Apr 21, 2011
Sold by
Roth Barry Mark
Bought by
Roth Barry M
Purchase Details
Closed on
Jul 29, 1998
Sold by
Mark Roth Barry
Bought by
Roth Barry Mark
Home Financials for this Owner
Home Financials are based on the most recent Mortgage that was taken out on this home.
Original Mortgage
$158,250
Outstanding Balance
$32,956
Interest Rate
6.9%
Estimated Equity
$986,858
Purchase Details
Closed on
Jun 26, 1996
Sold by
Roth Barry M and Roth Joleta L
Bought by
Roth Barry Mark
Home Financials for this Owner
Home Financials are based on the most recent Mortgage that was taken out on this home.
Original Mortgage
$156,800
Interest Rate
8.18%
Purchase Details
Closed on
Oct 11, 1985
Create a Home Valuation Report for This Property
The Home Valuation Report is an in-depth analysis detailing your home's value as well as a comparison with similar homes in the area
Home Values in the Area
Average Home Value in this Area
Purchase History
| Date | Buyer | Sale Price | Title Company |
|---|---|---|---|
| Roth Barry M | -- | Ticor Title Company | |
| Roth Barry M | -- | Ticor Title Company | |
| Roth Barry M | -- | None Available | |
| Roth Barry Mark | -- | Stewart Title | |
| Roth Barry Mark | -- | Stewart Title Company | |
| -- | $120,000 | -- |
Source: Public Records
Mortgage History
| Date | Status | Borrower | Loan Amount |
|---|---|---|---|
| Open | Roth Barry Mark | $158,250 | |
| Closed | Roth Barry Mark | $156,800 |
Source: Public Records
Tax History Compared to Growth
Tax History
| Year | Tax Paid | Tax Assessment Tax Assessment Total Assessment is a certain percentage of the fair market value that is determined by local assessors to be the total taxable value of land and additions on the property. | Land | Improvement |
|---|---|---|---|---|
| 2025 | $3,726 | $238,925 | $55,328 | $183,597 |
| 2024 | $3,726 | $234,242 | $54,244 | $179,998 |
| 2023 | $3,601 | $229,650 | $53,181 | $176,469 |
| 2022 | $3,548 | $225,148 | $52,139 | $173,009 |
| 2021 | $3,471 | $220,734 | $51,117 | $169,617 |
| 2020 | $3,391 | $218,471 | $50,593 | $167,878 |
| 2019 | $3,321 | $214,188 | $49,601 | $164,587 |
| 2018 | $3,236 | $209,989 | $48,629 | $161,360 |
| 2017 | $3,143 | $205,873 | $47,676 | $158,197 |
| 2016 | $3,049 | $201,838 | $46,742 | $155,096 |
| 2015 | $3,010 | $198,807 | $46,040 | $152,767 |
| 2014 | $2,962 | $194,914 | $45,139 | $149,775 |
Source: Public Records
Map
Nearby Homes
- 7506 Parkway Dr Unit 202
- 7506 Parkway Dr Unit 104
- 7500 Parkway Dr Unit 306
- 7495 Oakland Rd Unit 33
- 7495 Oakland Rd Unit 23
- 5590 Shasta Ln
- 5470 Baltimore Dr Unit 8
- 5450 Kiowa Dr Unit 81
- 5430 Baltimore Dr Unit 51
- 7240 Baldrich St
- 7700 Parkway Dr Unit 17
- 5440 Baltimore Dr Unit 90
- 5440 Baltimore Dr Unit 178
- 7195 Macquarie St
- 7780 Parkway Dr Unit 304
- 5350 Baltimore Dr Unit 47
- 5350 Baltimore Dr Unit 20
- 5366 Lake Murray Blvd
- Lot 48 Guava
- 5015 Comanche Dr
- 7572 Seton Hall St
- 7570 Seton Hall St
- 7574 Seton Hall St
- 5325 Tufts St
- 5330 Wheaton St
- 7576 Seton Hall St
- 5340 Wheaton St
- 5308 Tufts St
- 5333 Tufts St
- 5316 Tufts St
- 5300 Tufts St
- 5320 Wheaton St
- 7578 Seton Hall St
- 7571 Seton Hall St
- 7569 Seton Hall St
- 5292 Tufts St
- 5324 Tufts St
- 7573 Seton Hall St
- 5341 Tufts St
- 5284 Tufts St