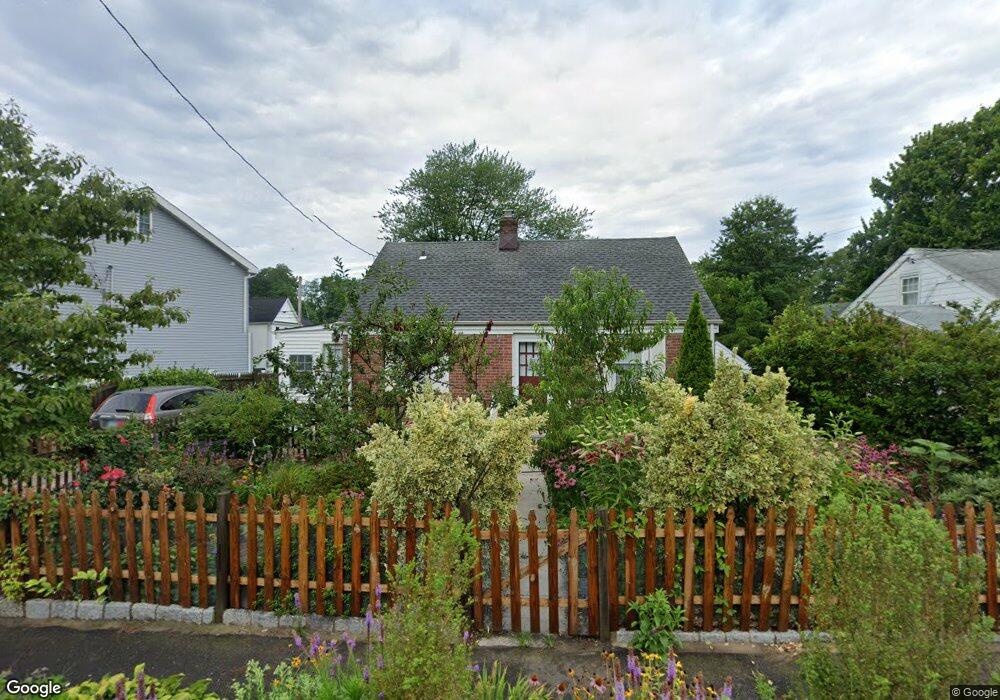
531 High St Fairfield, CT 06824
University NeighborhoodEstimated Value: $460,000 - $598,000
2
Beds
1
Bath
750
Sq Ft
$682/Sq Ft
Est. Value
About This Home
This home is located at 531 High St, Fairfield, CT 06824 and is currently estimated at $511,428, approximately $681 per square foot. 531 High St is a home located in Fairfield County with nearby schools including Holland Hill Elementary, Fairfield Woods Middle School, and Fairfield Ludlowe High School.
Ownership History
Date
Name
Owned For
Owner Type
Purchase Details
Closed on
Jun 27, 2008
Sold by
Delorenzo Michael A
Bought by
Nicholson Eric B
Current Estimated Value
Home Financials for this Owner
Home Financials are based on the most recent Mortgage that was taken out on this home.
Original Mortgage
$248,000
Outstanding Balance
$159,992
Interest Rate
6.07%
Estimated Equity
$351,436
Create a Home Valuation Report for This Property
The Home Valuation Report is an in-depth analysis detailing your home's value as well as a comparison with similar homes in the area
Home Values in the Area
Average Home Value in this Area
Purchase History
| Date | Buyer | Sale Price | Title Company |
|---|---|---|---|
| Nicholson Eric B | $310,000 | -- | |
| Nicholson Eric B | $310,000 | -- |
Source: Public Records
Mortgage History
| Date | Status | Borrower | Loan Amount |
|---|---|---|---|
| Open | Nicholson Eric B | $248,000 | |
| Closed | Nicholson Eric B | $248,000 |
Source: Public Records
Tax History
| Year | Tax Paid | Tax Assessment Tax Assessment Total Assessment is a certain percentage of the fair market value that is determined by local assessors to be the total taxable value of land and additions on the property. | Land | Improvement |
|---|---|---|---|---|
| 2025 | $5,803 | $204,400 | $182,000 | $22,400 |
| 2024 | $5,703 | $204,400 | $182,000 | $22,400 |
| 2023 | $5,623 | $204,400 | $182,000 | $22,400 |
| 2022 | $5,568 | $204,400 | $182,000 | $22,400 |
| 2021 | $5,515 | $204,400 | $182,000 | $22,400 |
| 2020 | $5,470 | $204,190 | $165,690 | $38,500 |
| 2019 | $5,470 | $204,190 | $165,690 | $38,500 |
| 2018 | $5,382 | $204,190 | $165,690 | $38,500 |
| 2017 | $5,272 | $204,190 | $165,690 | $38,500 |
| 2016 | $5,197 | $204,190 | $165,690 | $38,500 |
| 2015 | $6,065 | $244,650 | $205,800 | $38,850 |
| 2014 | $5,969 | $244,650 | $205,800 | $38,850 |
Source: Public Records
Map
Nearby Homes
- 12 Reynolds Dr
- 240 Sunnyridge Ave Unit 63
- 378 High St
- 274 High St
- 652 Black Rock Turnpike
- 65 Benton St
- 109 Jeniford Rd
- 28 Country Rd
- 37 Biro St
- 68 Figlar Ave
- 57 Hibiscus St Unit 1
- 187 Halley Ave
- 214 York Rd
- 341 Crestwood Rd
- 156 Halley Ave
- 41 Pepperbush Ln
- 21 Boroskey Rd
- 145 Brentwood Ave
- 108 Roseville St
- 245 Reid St
Your Personal Tour Guide
Ask me questions while you tour the home.