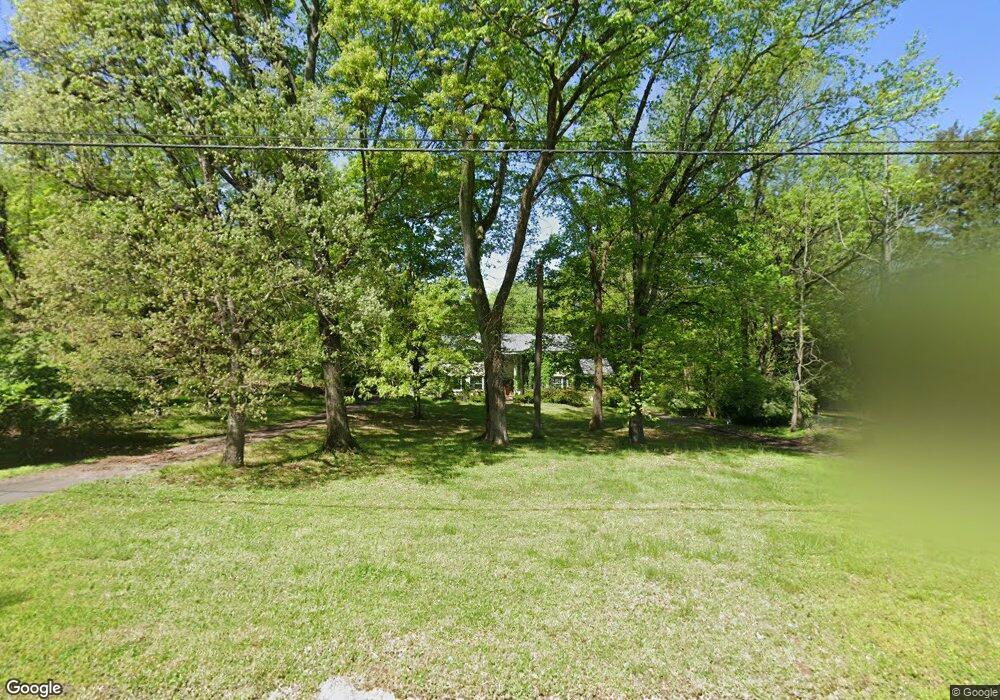
531 Idlewood Dr Mount Juliet, TN 37122
Estimated Value: $491,963 - $723,000
--
Bed
4
Baths
3,360
Sq Ft
$186/Sq Ft
Est. Value
About This Home
This home is located at 531 Idlewood Dr, Mount Juliet, TN 37122 and is currently estimated at $626,491, approximately $186 per square foot. 531 Idlewood Dr is a home located in Wilson County with nearby schools including Lakeview Elementary School, Mt. Juliet Middle School, and Green Hill High School.
Ownership History
Date
Name
Owned For
Owner Type
Purchase Details
Closed on
Jul 15, 2021
Sold by
Zeremba Kenneth S and Zeremba Lia Renee
Bought by
Zaremba Lisa Renee
Current Estimated Value
Home Financials for this Owner
Home Financials are based on the most recent Mortgage that was taken out on this home.
Original Mortgage
$260,000
Interest Rate
2.8%
Mortgage Type
New Conventional
Purchase Details
Closed on
Dec 20, 2010
Sold by
Witt Ruth
Bought by
Zaremba Kenneth S
Home Financials for this Owner
Home Financials are based on the most recent Mortgage that was taken out on this home.
Original Mortgage
$248,552
Interest Rate
4.37%
Mortgage Type
FHA
Purchase Details
Closed on
Sep 1, 2010
Sold by
Caputo Charles
Bought by
Witt Ruth
Purchase Details
Closed on
Jun 15, 1988
Bought by
Caputo Charles and Caputo Sharon
Purchase Details
Closed on
Jul 17, 1986
Bought by
Pearson Betty S
Create a Home Valuation Report for This Property
The Home Valuation Report is an in-depth analysis detailing your home's value as well as a comparison with similar homes in the area
Home Values in the Area
Average Home Value in this Area
Purchase History
| Date | Buyer | Sale Price | Title Company |
|---|---|---|---|
| Zaremba Lisa Renee | -- | Accommodation | |
| Zaremba Kenneth S | $251,900 | -- | |
| Witt Ruth | -- | -- | |
| Caputo Charles | $121,700 | -- | |
| Pearson Betty S | $120,000 | -- |
Source: Public Records
Mortgage History
| Date | Status | Borrower | Loan Amount |
|---|---|---|---|
| Previous Owner | Zaremba Lisa Renee | $260,000 | |
| Previous Owner | Zaremba Kenneth S | $248,552 |
Source: Public Records
Tax History Compared to Growth
Tax History
| Year | Tax Paid | Tax Assessment Tax Assessment Total Assessment is a certain percentage of the fair market value that is determined by local assessors to be the total taxable value of land and additions on the property. | Land | Improvement |
|---|---|---|---|---|
| 2024 | $1,694 | $88,750 | $17,500 | $71,250 |
| 2022 | $1,694 | $88,750 | $17,500 | $71,250 |
| 2021 | $1,694 | $88,750 | $17,500 | $71,250 |
| 2020 | $1,545 | $88,750 | $17,500 | $71,250 |
| 2019 | $1,545 | $61,350 | $7,500 | $53,850 |
| 2018 | $1,545 | $61,350 | $7,500 | $53,850 |
| 2017 | $1,545 | $61,350 | $7,500 | $53,850 |
| 2016 | $1,545 | $61,350 | $7,500 | $53,850 |
| 2015 | $1,577 | $61,350 | $7,500 | $53,850 |
| 2014 | $1,284 | $49,938 | $0 | $0 |
Source: Public Records
Map
Nearby Homes
- 1003 Bellwood Dr
- 3860 Saundersville Ferry Rd
- 877 Saundersville Ferry Rd
- 741 Saundersville Ferry Rd
- 3009 Nottingham Cir
- 589 Saundersville Ferry Rd
- 2005 Earl Pearce Cir
- 316 River Dr
- 306 Estate Dr
- 4245 Nonaville Rd
- 2027 Hunters Place
- 120 Ravens Crest Ave
- 1041 Cedar Creek Village Rd
- 320 Estate Dr
- 622 Oakwood Terrace
- 310 Weeping Elm Rd
- 1896 Saundersville Ferry Rd
- 802 Crystal Ct
- 1 Saundersville Ferry Rd
- 0 Cedar Grove Church Rd Unit RTC2942278
- 529 Idlewood Dr
- 533 Idlewood Dr
- 527 Idlewood Dr
- 535 Idlewood Dr
- 0 Idlewood Dr Unit 1828554
- 0 Idlewood Dr
- 534 Idlewood Dr
- 0 Hillbrook Dr
- 536 Idlewood Dr
- 538 Idlewood Dr
- 918 Green Valley Rd
- 920 Green Valley Rd
- 916 Green Valley Rd
- 922 Green Valley Rd
- 914 Green Valley Rd
- 523 Idlewood Dr
- 530 Idlewood Dr
- 539 Idlewood Dr
- 532 Idlewood Dr
- 904 Bellwood Dr