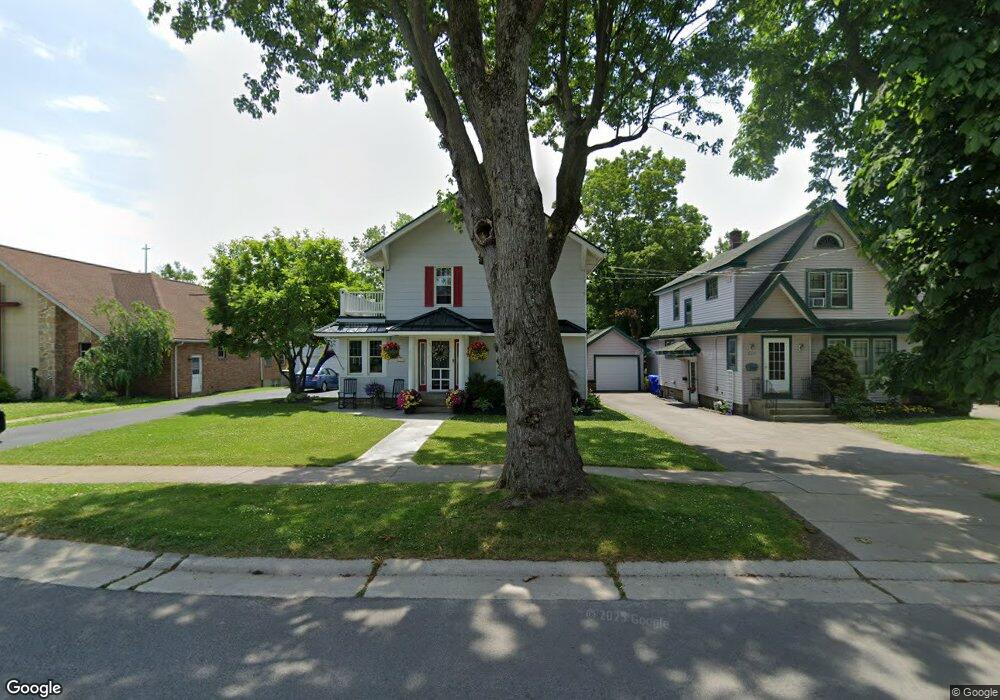
531 Main St West Seneca, NY 14224
Estimated Value: $273,000 - $332,000
4
Beds
2
Baths
2,302
Sq Ft
$133/Sq Ft
Est. Value
About This Home
This home is located at 531 Main St, West Seneca, NY 14224 and is currently estimated at $306,143, approximately $132 per square foot. 531 Main St is a home located in Erie County with nearby schools including West Elementary School, West Middle School, and West Seneca West Senior High School.
Ownership History
Date
Name
Owned For
Owner Type
Purchase Details
Closed on
Jul 29, 2005
Sold by
Scozzaro Anthony B and Scozzaro Patricia J
Bought by
Wisner R Todd and Wisner Tracy
Current Estimated Value
Home Financials for this Owner
Home Financials are based on the most recent Mortgage that was taken out on this home.
Original Mortgage
$113,905
Outstanding Balance
$59,874
Interest Rate
5.67%
Mortgage Type
Fannie Mae Freddie Mac
Estimated Equity
$246,269
Purchase Details
Closed on
Jan 2, 1997
Purchase Details
Closed on
Dec 30, 1996
Create a Home Valuation Report for This Property
The Home Valuation Report is an in-depth analysis detailing your home's value as well as a comparison with similar homes in the area
Home Values in the Area
Average Home Value in this Area
Purchase History
| Date | Buyer | Sale Price | Title Company |
|---|---|---|---|
| Wisner R Todd | $119,900 | -- | |
| -- | -- | -- | |
| -- | -- | -- |
Source: Public Records
Mortgage History
| Date | Status | Borrower | Loan Amount |
|---|---|---|---|
| Open | Wisner R Todd | $113,905 |
Source: Public Records
Tax History
| Year | Tax Paid | Tax Assessment Tax Assessment Total Assessment is a certain percentage of the fair market value that is determined by local assessors to be the total taxable value of land and additions on the property. | Land | Improvement |
|---|---|---|---|---|
| 2024 | $5,477 | $53,700 | $6,300 | $47,400 |
| 2023 | $5,361 | $53,700 | $6,300 | $47,400 |
| 2022 | $5,274 | $53,700 | $6,300 | $47,400 |
| 2021 | $5,237 | $53,700 | $6,300 | $47,400 |
| 2020 | $4,737 | $53,700 | $6,300 | $47,400 |
| 2019 | $4,392 | $53,700 | $6,300 | $47,400 |
| 2018 | $4,208 | $50,200 | $6,300 | $43,900 |
| 2017 | $2,395 | $50,200 | $6,300 | $43,900 |
| 2016 | $4,087 | $50,200 | $6,300 | $43,900 |
| 2015 | -- | $50,200 | $6,300 | $43,900 |
| 2014 | -- | $50,200 | $6,300 | $43,900 |
Source: Public Records
Map
Nearby Homes
Your Personal Tour Guide
Ask me questions while you tour the home.