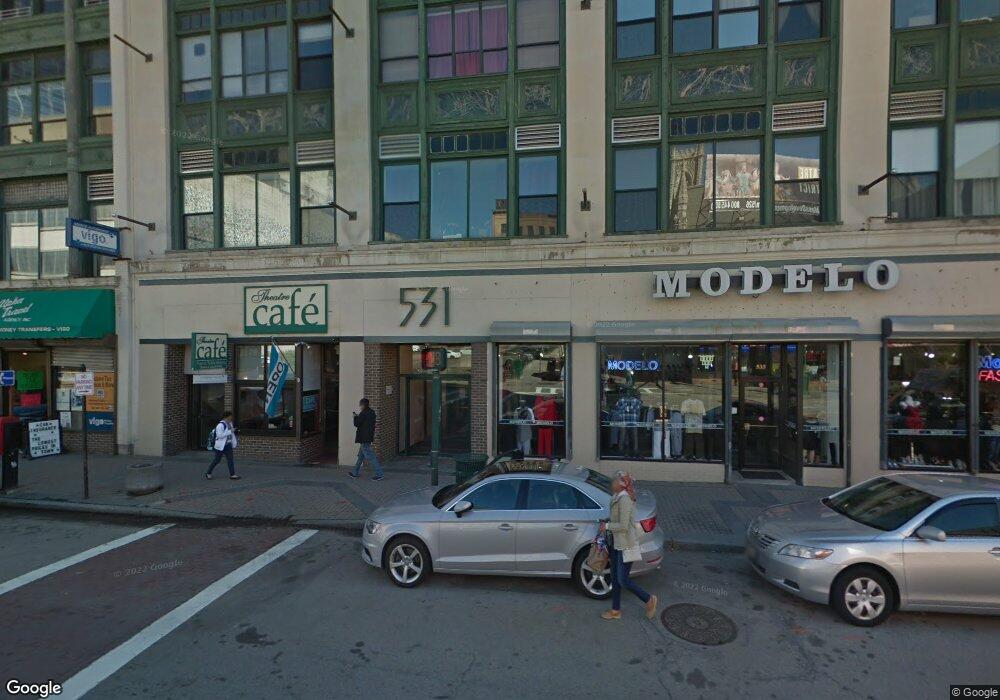
531 Main St Unit 411 Worcester, MA 01608
Downtown Worcester NeighborhoodEstimated Value: $161,000 - $221,421
1
Bed
1
Bath
646
Sq Ft
$281/Sq Ft
Est. Value
About This Home
This home is located at 531 Main St Unit 411, Worcester, MA 01608 and is currently estimated at $181,355, approximately $280 per square foot. 531 Main St Unit 411 is a home located in Worcester County with nearby schools including Chandler Elementary Community School, Jacob Hiatt Magnet School, and Chandler Magnet.
Ownership History
Date
Name
Owned For
Owner Type
Purchase Details
Closed on
Sep 12, 2006
Sold by
Pappas Industri Parks
Bought by
Gutierrez William
Current Estimated Value
Home Financials for this Owner
Home Financials are based on the most recent Mortgage that was taken out on this home.
Original Mortgage
$67,410
Interest Rate
6.79%
Mortgage Type
Purchase Money Mortgage
Create a Home Valuation Report for This Property
The Home Valuation Report is an in-depth analysis detailing your home's value as well as a comparison with similar homes in the area
Home Values in the Area
Average Home Value in this Area
Purchase History
| Date | Buyer | Sale Price | Title Company |
|---|---|---|---|
| Gutierrez William | $74,900 | -- | |
| Gutierrez William | $74,900 | -- |
Source: Public Records
Mortgage History
| Date | Status | Borrower | Loan Amount |
|---|---|---|---|
| Open | Gutierrez William | $67,900 | |
| Closed | Gutierrez William | $67,410 |
Source: Public Records
Tax History Compared to Growth
Tax History
| Year | Tax Paid | Tax Assessment Tax Assessment Total Assessment is a certain percentage of the fair market value that is determined by local assessors to be the total taxable value of land and additions on the property. | Land | Improvement |
|---|---|---|---|---|
| 2025 | $2,047 | $155,200 | $0 | $155,200 |
| 2024 | $1,756 | $127,700 | $0 | $127,700 |
| 2023 | $1,494 | $104,200 | $0 | $104,200 |
| 2022 | $1,297 | $85,300 | $0 | $85,300 |
| 2021 | $1,044 | $64,100 | $0 | $64,100 |
| 2020 | $1,176 | $69,200 | $0 | $69,200 |
| 2019 | $880 | $48,900 | $0 | $48,900 |
| 2018 | $798 | $42,200 | $0 | $42,200 |
| 2017 | $794 | $41,300 | $0 | $41,300 |
| 2016 | $851 | $41,300 | $0 | $41,300 |
| 2015 | $829 | $41,300 | $0 | $41,300 |
| 2014 | $807 | $41,300 | $0 | $41,300 |
Source: Public Records
Map
Nearby Homes
- 531 Main St Unit 503
- 531 Main St Unit 410
- 531 Main St Unit 403
- 70 Southbridge St Unit 310
- 70 Southbridge St Unit 611
- 44 Elm St Unit 501
- 93 Austin St
- 58 Elm St Unit 11
- 56 Elm St Unit 1
- 58 Elm St Unit 1
- 13 West St
- 111 Austin St
- 230 Pleasant St
- 42 William St
- 38 1/2 Bowdoin St
- 21 Fruit St
- 146 -152 Chandler
- 7 Lodi St
- 22 Waverly St
- 61 William St
- 531 Main St Unit 601
- 531 Main St Unit 510
- 531 Main St Unit 509
- 531 Main St Unit 508
- 531 Main St Unit 507
- 531 Main St Unit 506
- 531 Main St Unit 505
- 531 Main St Unit 504
- 531 Main St Unit 502
- 531 Main St Unit 501
- 531 Main St Unit 412
- 531 Main St Unit 409
- 531 Main St Unit 408
- 531 Main St Unit 407
- 531 Main St Unit 406
- 531 Main St Unit 405
- 531 Main St Unit 404
- 531 Main St Unit 402
- 531 Main St Unit 401
- 531 Main St Unit 312