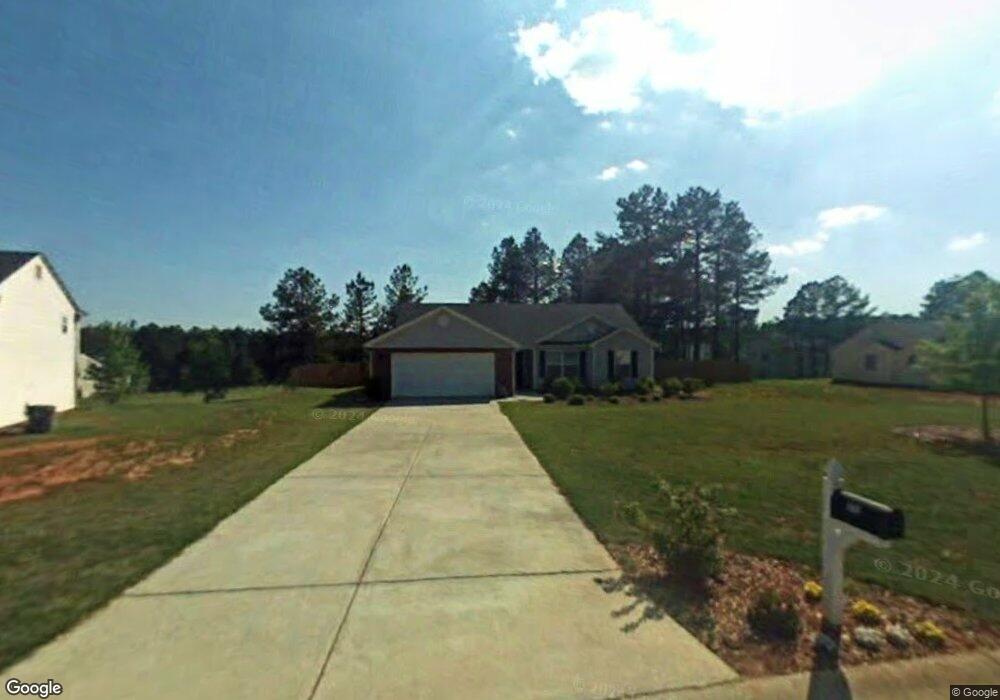
531 Pin Oak Dr Unit 21C Bethlehem, GA 30620
Estimated Value: $300,000 - $328,000
3
Beds
2
Baths
1,340
Sq Ft
$236/Sq Ft
Est. Value
About This Home
This home is located at 531 Pin Oak Dr Unit 21C, Bethlehem, GA 30620 and is currently estimated at $316,388, approximately $236 per square foot. 531 Pin Oak Dr Unit 21C is a home located in Barrow County with nearby schools including Yargo Elementary School, Haymon-Morris Middle School, and Apalachee High School.
Ownership History
Date
Name
Owned For
Owner Type
Purchase Details
Closed on
Sep 23, 2016
Sold by
Smith Roseanna
Bought by
Lingefelt Sylvia Marie
Current Estimated Value
Home Financials for this Owner
Home Financials are based on the most recent Mortgage that was taken out on this home.
Original Mortgage
$154,138
Outstanding Balance
$123,120
Interest Rate
3.43%
Mortgage Type
New Conventional
Estimated Equity
$193,268
Purchase Details
Closed on
May 15, 2007
Sold by
Thompson Kevin M
Bought by
Smith Roseanna M
Home Financials for this Owner
Home Financials are based on the most recent Mortgage that was taken out on this home.
Original Mortgage
$135,000
Interest Rate
6.12%
Mortgage Type
New Conventional
Purchase Details
Closed on
Apr 2, 2004
Sold by
Star Hm Builders Inc
Bought by
Thompson Kevin M
Home Financials for this Owner
Home Financials are based on the most recent Mortgage that was taken out on this home.
Original Mortgage
$118,680
Interest Rate
5.55%
Mortgage Type
New Conventional
Purchase Details
Closed on
Nov 25, 2003
Sold by
Parkview Development Inc
Bought by
Star Home Builders Inc
Purchase Details
Closed on
May 2, 2000
Bought by
Parkview Development Inc
Create a Home Valuation Report for This Property
The Home Valuation Report is an in-depth analysis detailing your home's value as well as a comparison with similar homes in the area
Home Values in the Area
Average Home Value in this Area
Purchase History
| Date | Buyer | Sale Price | Title Company |
|---|---|---|---|
| Lingefelt Sylvia Marie | $149,900 | -- | |
| Smith Roseanna M | $135,000 | -- | |
| Thompson Kevin M | $116,900 | -- | |
| Star Home Builders Inc | $330,000 | -- | |
| Parkview Development Inc | -- | -- |
Source: Public Records
Mortgage History
| Date | Status | Borrower | Loan Amount |
|---|---|---|---|
| Open | Lingefelt Sylvia Marie | $154,138 | |
| Previous Owner | Smith Roseanna M | $135,000 | |
| Previous Owner | Thompson Kevin M | $118,680 |
Source: Public Records
Tax History Compared to Growth
Tax History
| Year | Tax Paid | Tax Assessment Tax Assessment Total Assessment is a certain percentage of the fair market value that is determined by local assessors to be the total taxable value of land and additions on the property. | Land | Improvement |
|---|---|---|---|---|
| 2024 | $2,546 | $103,344 | $25,200 | $78,144 |
| 2023 | $2,139 | $103,744 | $25,200 | $78,544 |
| 2022 | $2,051 | $72,252 | $20,000 | $52,252 |
| 2021 | $1,886 | $63,066 | $16,000 | $47,066 |
| 2020 | $1,680 | $56,153 | $16,000 | $40,153 |
| 2019 | $1,708 | $56,153 | $16,000 | $40,153 |
| 2018 | $1,599 | $53,353 | $13,200 | $40,153 |
| 2017 | $1,332 | $45,750 | $13,200 | $32,550 |
| 2016 | $1,173 | $40,456 | $13,200 | $27,256 |
| 2015 | $1,187 | $40,754 | $13,200 | $27,554 |
| 2014 | $995 | $34,321 | $6,468 | $27,853 |
| 2013 | -- | $32,954 | $6,468 | $26,486 |
Source: Public Records
Map
Nearby Homes
- 0 Jb Owens Unit 7552902
- 0 Jb Owens Unit 7552891
- 0 Jb Owens Unit LOT 2 - 2.09 ACRES
- 0 Jb Owens Unit LOT 3 - 2.01 ACRES
- 303 Ron Dr
- 209 Angie Way
- 190 Lokeys Ln
- 637 Sleeping Meadow Ln
- 0 Tanners Bridge Rd Unit 10588144
- 1129 Loganville Hwy
- 763 Moss Side Dr
- 286 Meadows Dr
- 758 Clarence Edwards Rd
- 1111 Otis Dr
- 1071 Covenant Ct
- 103 Camp Ct
- 384 Winslow Ct
- 1024 Lyndhurst Ln
- 1164 Otis Dr
- 934 Beaver Hill Dr
- 531 Pin Oak Dr
- 533 Pin Oak Dr Unit 22C
- 533 Pin Oak Dr
- 525 Pin Oak Dr
- 529 Pin Oak Dr Unit 3
- 1204 Persimmon Place Dr Unit 19C
- 1204 Persimmon Place Dr
- 0 Pin Oak Dr Unit 8252047
- 0 Pin Oak Dr Unit 8190234
- 0 Pin Oak Dr Unit 8877672
- 0 Pin Oak Dr Unit 3216174
- 0 Pin Oak Dr Unit 7277777
- 0 Pin Oak Dr Unit 7527917
- 0 Pin Oak Dr Unit 8069905
- 0 Pin Oak Dr Unit 8165182
- 0 Pin Oak Dr
- 111 Trail Winds Dr
- 56 Hargrave Ave
- 40 Hargrave Ave
- 535 Pin Oak Dr Unit 3