531 Ross Rd Broken Bow, OK 74728
Estimated Value: $92,000 - $445,000
2
Beds
1
Bath
1,114
Sq Ft
$215/Sq Ft
Est. Value
About This Home
This home is located at 531 Ross Rd, Broken Bow, OK 74728 and is currently estimated at $239,445, approximately $214 per square foot. 531 Ross Rd is a home located in McCurtain County with nearby schools including Dierks Elementary School, Bennett Elementary School, and Rector Johnson Middle School.
Ownership History
Date
Name
Owned For
Owner Type
Purchase Details
Closed on
Dec 20, 2024
Sold by
Foshee Belinda Jo and Marty And Belinda Foshee Trust
Bought by
Davis Nathanael Paul and Davis Amanda Jo
Current Estimated Value
Purchase Details
Closed on
Jan 4, 2022
Sold by
Cheryl Harris-Moore
Bought by
Loftice Marty and Loftice Angie
Purchase Details
Closed on
Nov 4, 2021
Sold by
Foshee Belinda Jo and Ross Martin
Bought by
Marty And Belinda Foshee Trust
Purchase Details
Closed on
Feb 25, 2005
Sold by
Brand Stephen G and Brand Lanelle S
Bought by
Foshee Amanda Jo
Home Financials for this Owner
Home Financials are based on the most recent Mortgage that was taken out on this home.
Original Mortgage
$28,838
Interest Rate
5.71%
Mortgage Type
Purchase Money Mortgage
Purchase Details
Closed on
Jun 18, 2001
Sold by
Shelton Clifford and Shelton Laver
Bought by
Shelton Clifford and Shelton Lave
Create a Home Valuation Report for This Property
The Home Valuation Report is an in-depth analysis detailing your home's value as well as a comparison with similar homes in the area
Home Values in the Area
Average Home Value in this Area
Purchase History
| Date | Buyer | Sale Price | Title Company |
|---|---|---|---|
| Davis Nathanael Paul | $35,000 | None Listed On Document | |
| Loftice Marty | $6,000 | None Listed On Document | |
| Marty And Belinda Foshee Trust | -- | None Listed On Document | |
| The Marty And Belinda Foshee Trust | -- | None Available | |
| Foshee Amanda Jo | $32,667 | None Available | |
| Shelton Clifford | -- | -- |
Source: Public Records
Mortgage History
| Date | Status | Borrower | Loan Amount |
|---|---|---|---|
| Previous Owner | Foshee Amanda Jo | $28,838 |
Source: Public Records
Tax History Compared to Growth
Tax History
| Year | Tax Paid | Tax Assessment Tax Assessment Total Assessment is a certain percentage of the fair market value that is determined by local assessors to be the total taxable value of land and additions on the property. | Land | Improvement |
|---|---|---|---|---|
| 2025 | $323 | $5,027 | $176 | $4,851 |
| 2024 | $323 | $4,881 | $171 | $4,710 |
| 2023 | $306 | $4,739 | $154 | $4,585 |
| 2022 | $295 | $4,601 | $137 | $4,464 |
| 2021 | $280 | $4,467 | $120 | $4,347 |
| 2020 | $271 | $4,337 | $104 | $4,233 |
| 2019 | $262 | $4,210 | $99 | $4,111 |
| 2018 | $255 | $4,088 | $94 | $3,994 |
| 2017 | $247 | $3,969 | $90 | $3,879 |
| 2016 | $239 | $3,853 | $212 | $3,641 |
| 2015 | $245 | $3,853 | $212 | $3,641 |
| 2014 | $246 | $3,853 | $212 | $3,641 |
Source: Public Records
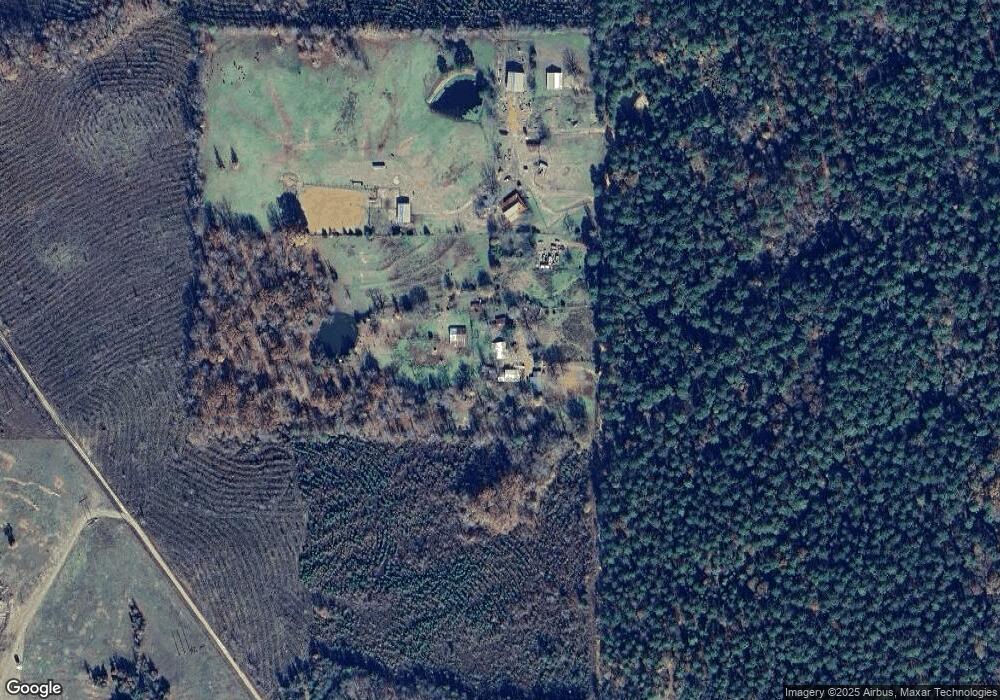
Map
Nearby Homes
- 657 Canoe Rd
- 116 Sunfish Bay Ln
- 513 Turtle Trail
- 24 Pine Warbler Trail
- 344 Fat Bass Trail
- 245 Green Mallard Trail
- 105 Green Mallard Trail
- 205 Main St
- 720 Mudline Rd
- 962 Red Fox Rd
- 868 Red Fox Rd
- 1091 Bailey Rd
- 1248 Joe Hough Rd
- 2460 Bailey Rd
- 06 Hidden Acres Rd
- 07 Pine Acres Rd
- 713 E 11th St
- 482 Retreat Loop
- 458 Retreat Loop
- 79 Silent Stream Trail
- 279 Ross Rd
- 238 Ross Rd
- 8943 Craig Rd
- 6496 E Us Highway 70
- 6496 E Us Highway 70
- 8908 Craig Rd
- 6745 E Us Highway 70
- 5900 E Us Highway 70
- 734 Canoe Rd
- 734 Canoe Rd Unit 9188491876
- 103 Tree Frog Trail
- 6768 E 6768 Us Hwy 70 E
- 6768 E Us Highway 70
- TBD Craig Rd
- 9226 U S 70
- 0 Canoe Rd
- 471 Canoe Rd
- 609 Canoe Rd
- 5570 E Us Highway 70
- 701 Canoe Rd