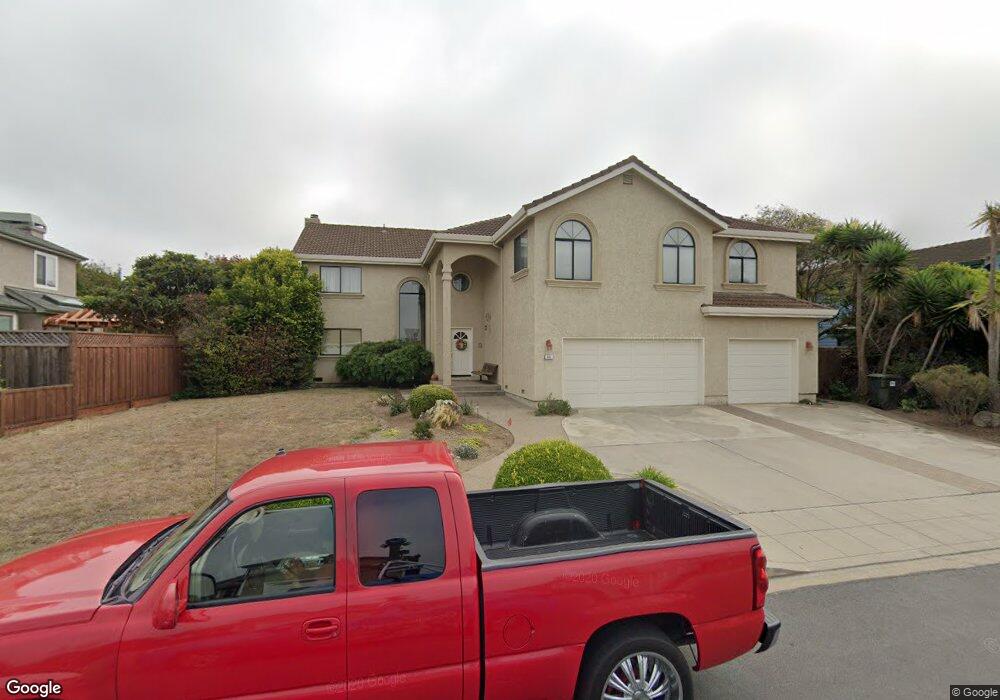
531 Silver Ave Half Moon Bay, CA 94019
Estimated Value: $1,857,000 - $2,172,000
4
Beds
4
Baths
3,350
Sq Ft
$619/Sq Ft
Est. Value
About This Home
This home is located at 531 Silver Ave, Half Moon Bay, CA 94019 and is currently estimated at $2,072,636, approximately $618 per square foot. 531 Silver Ave is a home located in San Mateo County with nearby schools including Alvin S. Hatch Elementary School, Manuel F. Cunha Intermediate School, and Half Moon Bay High School.
Ownership History
Date
Name
Owned For
Owner Type
Purchase Details
Closed on
Jul 19, 2021
Sold by
Betty K Broglio 2013 Living Trust and Broglio Betty K
Bought by
Betty K Broglio 2013 Living Trust and Broglio
Current Estimated Value
Home Financials for this Owner
Home Financials are based on the most recent Mortgage that was taken out on this home.
Original Mortgage
$3,151,260
Outstanding Balance
$3,095,067
Interest Rate
2.96%
Mortgage Type
Reverse Mortgage Home Equity Conversion Mortgage
Estimated Equity
-$1,022,431
Purchase Details
Closed on
Sep 13, 2013
Sold by
Broglio Betty K
Bought by
Broglio Betty K
Purchase Details
Closed on
Jul 12, 2012
Sold by
Broglio Betty K
Bought by
Broglio Betty K
Home Financials for this Owner
Home Financials are based on the most recent Mortgage that was taken out on this home.
Original Mortgage
$241,500
Interest Rate
3.7%
Mortgage Type
New Conventional
Purchase Details
Closed on
Jan 31, 1994
Sold by
Broglio Edward L
Bought by
Broglio Betty K
Create a Home Valuation Report for This Property
The Home Valuation Report is an in-depth analysis detailing your home's value as well as a comparison with similar homes in the area
Home Values in the Area
Average Home Value in this Area
Purchase History
| Date | Buyer | Sale Price | Title Company |
|---|---|---|---|
| Betty K Broglio 2013 Living Trust | -- | Lawyers Title | |
| Broglio Betty K | -- | None Available | |
| Broglio Betty K | -- | Old Republic Title Company | |
| Broglio Betty K | -- | -- |
Source: Public Records
Mortgage History
| Date | Status | Borrower | Loan Amount |
|---|---|---|---|
| Open | Betty K Broglio 2013 Living Trust | $3,151,260 | |
| Previous Owner | Broglio Betty K | $241,500 |
Source: Public Records
Tax History
| Year | Tax Paid | Tax Assessment Tax Assessment Total Assessment is a certain percentage of the fair market value that is determined by local assessors to be the total taxable value of land and additions on the property. | Land | Improvement |
|---|---|---|---|---|
| 2025 | $9,655 | $766,559 | $315,639 | $450,920 |
| 2023 | $9,655 | $736,794 | $303,383 | $433,411 |
| 2022 | $8,997 | $722,348 | $297,435 | $424,913 |
| 2021 | $8,728 | $708,185 | $291,603 | $416,582 |
| 2020 | $8,620 | $700,924 | $288,613 | $412,311 |
| 2019 | $8,537 | $687,181 | $282,954 | $404,227 |
| 2018 | $8,018 | $673,707 | $277,406 | $396,301 |
| 2017 | $7,939 | $660,498 | $271,967 | $388,531 |
| 2016 | $7,910 | $647,548 | $266,635 | $380,913 |
| 2015 | $7,670 | $637,822 | $262,630 | $375,192 |
| 2014 | $7,482 | $625,329 | $257,486 | $367,843 |
Source: Public Records
Map
Nearby Homes
- 567 Terrace Ave
- 613 Grandview Blvd
- 411 Belleville Blvd
- 414 Belleville Blvd
- 0 Upper Terrace Ave
- 0 Pacific Ave Unit ML82035704
- 535 Creekside Ct Unit LOT 3
- 455 Pine Ave
- 1563 Mizzen Ln Unit 2
- 1527 Hawser Ln
- 460 Pine Ave Unit 46
- 430 Pine Ave
- 55 Erin Ln
- 78 Amesport Landing
- 229 Garcia Ave
- 345 Granelli Ave
- 656 Myrtle St
- 614 Myrtle St
- 00 Park Ave
- 000 Bonita Ave
- 535 Silver Ave
- 527 Silver Ave
- 538 Highland Ave
- 542 Highland Ave
- 534 Highland Ave
- 526 Silver Ave
- 523 Silver Ave
- 539 Silver Ave
- 530 Silver Ave
- 546 Highland Ave
- 522 Silver Ave
- 534 Silver Ave
- 530 Highland Ave
- 518 Silver Ave
- 519 Silver Ave
- 538 Silver Ave
- 575 Highland Ave
- 563 Highland Ave
- 551 Terrace Ave
- 559 Terrace Ave
Your Personal Tour Guide
Ask me questions while you tour the home.