Estimated Value: $395,645 - $627,000
Studio
3
Baths
1,532
Sq Ft
$327/Sq Ft
Est. Value
About This Home
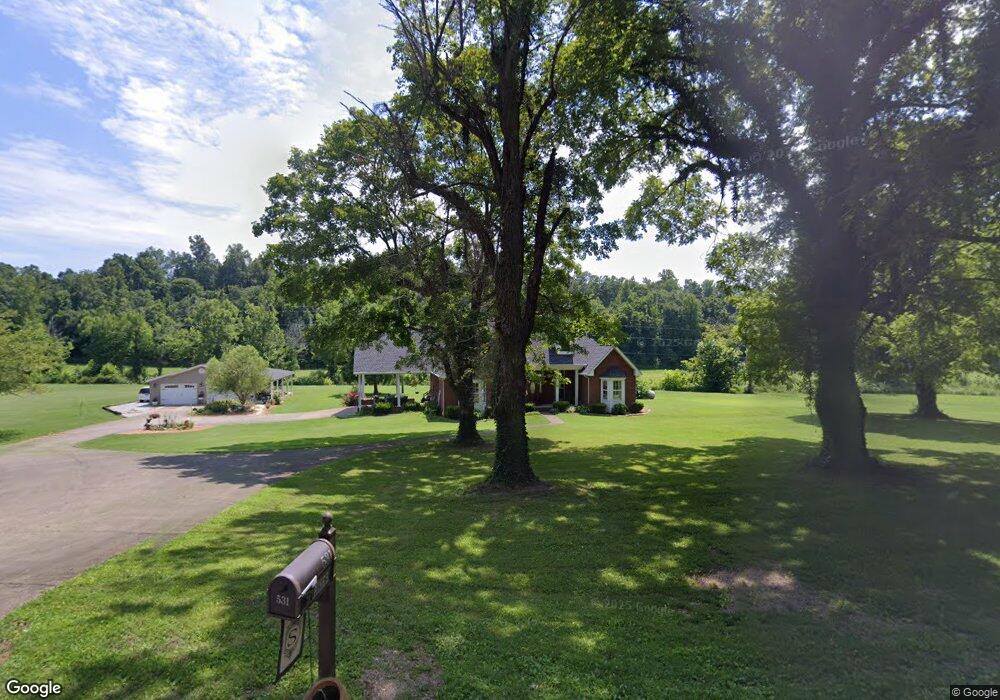
This home is located at 531 Upper Standing Rock Rd, Dover, TN 37058 and is currently estimated at $500,661, approximately $326 per square foot. 531 Upper Standing Rock Rd is a home located in Stewart County with nearby schools including Dover Elementary School, Stewart County Middle School, and Stewart County High School.
Ownership History
Date
Name
Owned For
Owner Type
Purchase Details
Closed on
Sep 19, 2017
Sold by
Bryant David
Bought by
Staines John M and Staines Kimberly Ann
Current Estimated Value
Home Financials for this Owner
Home Financials are based on the most recent Mortgage that was taken out on this home.
Original Mortgage
$304,025
Outstanding Balance
$160,331
Interest Rate
3.86%
Mortgage Type
VA
Estimated Equity
$340,330
Purchase Details
Closed on
Jan 25, 2011
Sold by
Swift Jerry
Bought by
Otto Harold
Purchase Details
Closed on
Feb 24, 2009
Sold by
Swift Jerry
Bought by
Stevens William A
Purchase Details
Closed on
Sep 16, 2008
Sold by
Gloria Perigo
Bought by
Bryant David E
Home Financials for this Owner
Home Financials are based on the most recent Mortgage that was taken out on this home.
Original Mortgage
$175,000
Interest Rate
6.45%
Mortgage Type
New Conventional
Purchase Details
Closed on
Sep 11, 2008
Sold by
Bryant David E
Bought by
Jerry Swift
Home Financials for this Owner
Home Financials are based on the most recent Mortgage that was taken out on this home.
Original Mortgage
$175,000
Interest Rate
6.45%
Mortgage Type
New Conventional
Purchase Details
Closed on
Jul 18, 1983
Bought by
Thompson Paul W and Thompson Shirley A
Create a Home Valuation Report for This Property
The Home Valuation Report is an in-depth analysis detailing your home's value as well as a comparison with similar homes in the area
Purchase History
| Date | Buyer | Sale Price | Title Company |
|---|---|---|---|
| Staines John M | $320,000 | -- | |
| Otto Harold | $43,689 | -- | |
| Stevens William A | $18,000 | -- | |
| Bryant David E | $300,000 | -- | |
| Jerry Swift | $79,080 | -- | |
| Thompson Paul W | -- | -- |
Source: Public Records
Mortgage History
| Date | Status | Borrower | Loan Amount |
|---|---|---|---|
| Open | Staines John M | $304,025 | |
| Previous Owner | Thompson Paul W | $175,000 |
Source: Public Records
Tax History
| Year | Tax Paid | Tax Assessment Tax Assessment Total Assessment is a certain percentage of the fair market value that is determined by local assessors to be the total taxable value of land and additions on the property. | Land | Improvement |
|---|---|---|---|---|
| 2025 | $1,184 | $79,650 | $11,200 | $68,450 |
| 2024 | $1,184 | $79,650 | $11,200 | $68,450 |
| 2023 | $1,212 | $51,325 | $8,750 | $42,575 |
| 2022 | $1,212 | $51,325 | $8,750 | $42,575 |
| 2021 | $1,212 | $51,325 | $8,750 | $42,575 |
| 2020 | $1,215 | $51,325 | $8,750 | $42,575 |
| 2019 | $1,215 | $47,650 | $8,000 | $39,650 |
| 2018 | $1,032 | $47,650 | $8,000 | $39,650 |
| 2017 | $1,032 | $40,475 | $8,000 | $32,475 |
| 2016 | $1,032 | $40,475 | $8,000 | $32,475 |
| 2015 | $1,000 | $40,475 | $8,000 | $32,475 |
| 2014 | $1,007 | $40,475 | $8,000 | $32,475 |
| 2013 | $1,007 | $40,786 | $0 | $0 |
Source: Public Records
Map
Nearby Homes
- 01 Terrapin Run Rd
- 1 Terrapin Run Rd
- 0 N Fork Rd Unit 2
- 0 N Fork Rd Unit 8A
- 0 N Fork Rd Unit 3B
- 0 N Fork Rd Unit 5
- 0 N Fork Rd Unit 7A
- 0 N Fork Rd Unit 3A
- 0 N Fork Rd Unit 7B
- 0 N Fork Rd Unit 4
- 0 N Fork Rd Unit 8B
- 0 Old Hwy 18
- N Fork Tract 8
- E Fork Leatherwood Rd
- 0 Old Highway 18 Unit 24351588
- 0 Old Highway 18 Unit 4
- 0 Old Highway 18 Unit 8
- 0 Old Highway 18 Unit 3
- 0 Old Highway 18 Unit 9
- 738 Keel Hollow Rd
- 492 Upper Standing Rock Rd
- 491 Upper Standing Rock Rd
- 440 Upper Standing Rock Rd
- 330 Upper Standing Rock Rd
- 231 Parker Ln
- 207 Parker Ln
- 198 Parker Ln
- 305 Upper Standing Rock Rd
- 780 Upper Standing Rock Rd
- 780 Upper Standing Rock Rd
- 780 Upper Standing Rock Rd
- 780 Upper Standing Rock Rd
- 780 Upper Standing Rock Rd
- 780 Upper Standing Rock Rd
- 780 Upper Standing Rock Rd
- 780 Upper Standing Rock Rd
- 234 Upper Standing Rock Rd
- 235 Upper Standing Rock Rd
Your Personal Tour Guide
Ask me questions while you tour the home.