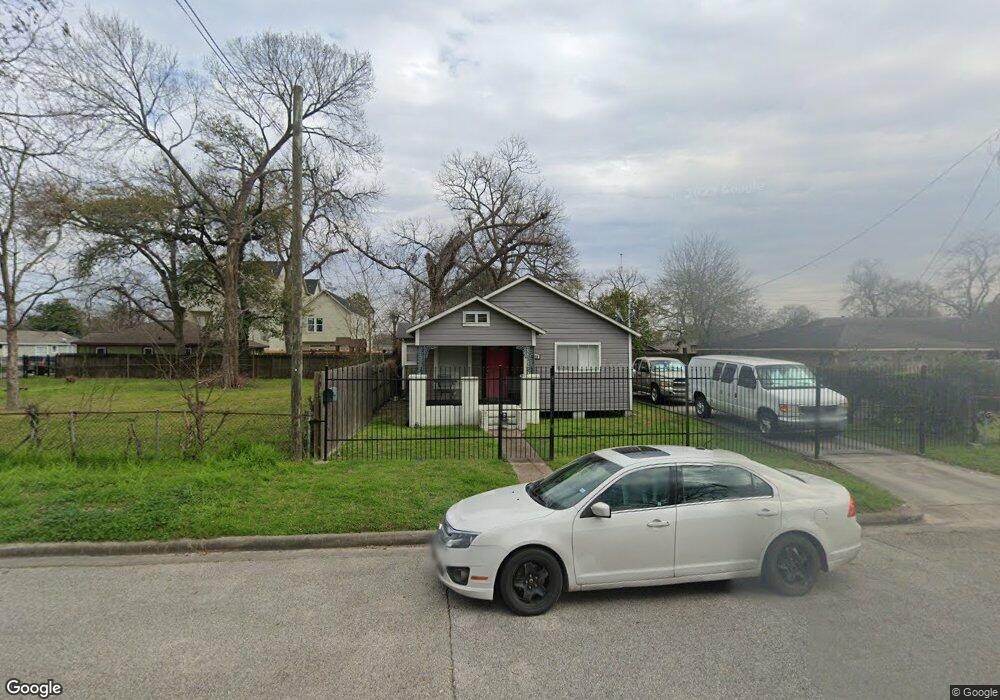
5310 Terry St Houston, TX 77009
Ryon NeighborhoodEstimated Value: $262,219 - $312,000
2
Beds
2
Baths
1,176
Sq Ft
$237/Sq Ft
Est. Value
About This Home
This home is located at 5310 Terry St, Houston, TX 77009 and is currently estimated at $279,055, approximately $237 per square foot. 5310 Terry St is a home located in Harris County with nearby schools including Jefferson Elementary School, Marshall Middle, and Northside High School.
Ownership History
Date
Name
Owned For
Owner Type
Purchase Details
Closed on
Oct 17, 2007
Sold by
Ross David
Bought by
Clark Travis
Current Estimated Value
Purchase Details
Closed on
Aug 9, 2007
Sold by
Capital Resources Group Inc
Bought by
Ross David and The Terry Melvin Trust
Home Financials for this Owner
Home Financials are based on the most recent Mortgage that was taken out on this home.
Original Mortgage
$76,000
Interest Rate
6.48%
Mortgage Type
Purchase Money Mortgage
Purchase Details
Closed on
Feb 9, 2007
Sold by
Charles Melvin Theo
Bought by
Capital Resources Group Inc
Home Financials for this Owner
Home Financials are based on the most recent Mortgage that was taken out on this home.
Original Mortgage
$70,000
Interest Rate
6.26%
Mortgage Type
Purchase Money Mortgage
Create a Home Valuation Report for This Property
The Home Valuation Report is an in-depth analysis detailing your home's value as well as a comparison with similar homes in the area
Home Values in the Area
Average Home Value in this Area
Purchase History
| Date | Buyer | Sale Price | Title Company |
|---|---|---|---|
| Clark Travis | -- | Stewart Title Houston Div | |
| Ross David | -- | None Available | |
| Capital Resources Group Inc | -- | Stewart Title Of Montgomery |
Source: Public Records
Mortgage History
| Date | Status | Borrower | Loan Amount |
|---|---|---|---|
| Previous Owner | Ross David | $76,000 | |
| Previous Owner | Capital Resources Group Inc | $70,000 |
Source: Public Records
Tax History Compared to Growth
Tax History
| Year | Tax Paid | Tax Assessment Tax Assessment Total Assessment is a certain percentage of the fair market value that is determined by local assessors to be the total taxable value of land and additions on the property. | Land | Improvement |
|---|---|---|---|---|
| 2025 | $5,058 | $225,186 | $150,000 | $75,186 |
| 2024 | $5,058 | $241,740 | $150,000 | $91,740 |
| 2023 | $5,058 | $221,000 | $125,000 | $96,000 |
| 2022 | $4,868 | $221,093 | $125,000 | $96,093 |
| 2021 | $4,444 | $185,199 | $85,000 | $100,199 |
| 2020 | $4,439 | $183,319 | $85,000 | $98,319 |
| 2019 | $4,343 | $171,648 | $85,000 | $86,648 |
| 2018 | $3,637 | $143,736 | $60,000 | $83,736 |
| 2017 | $3,689 | $145,905 | $50,000 | $95,905 |
| 2016 | $3,104 | $122,773 | $45,000 | $77,773 |
| 2015 | $2,144 | $106,949 | $27,500 | $79,449 |
| 2014 | $2,144 | $83,391 | $22,500 | $60,891 |
Source: Public Records
Map
Nearby Homes
- 5314 Terry St
- 1504 Griffin St
- 1506 Griffin St
- 0 Griffin St
- 1713 Tarley St
- 5119 Terry St
- 5201 Chapman St
- 5418 Elysian St
- 5311 Gano St
- 5121 Elysian St
- 5105 Chapman St
- 5604 Gano St
- 5606 Gano St
- 5518 Cochran St
- 5206 Robertson St
- 4913 Elysian St
- 4918 Elysian St
- 1509 Moody St
- 5712 Elysian St
- 5708 Elysian St