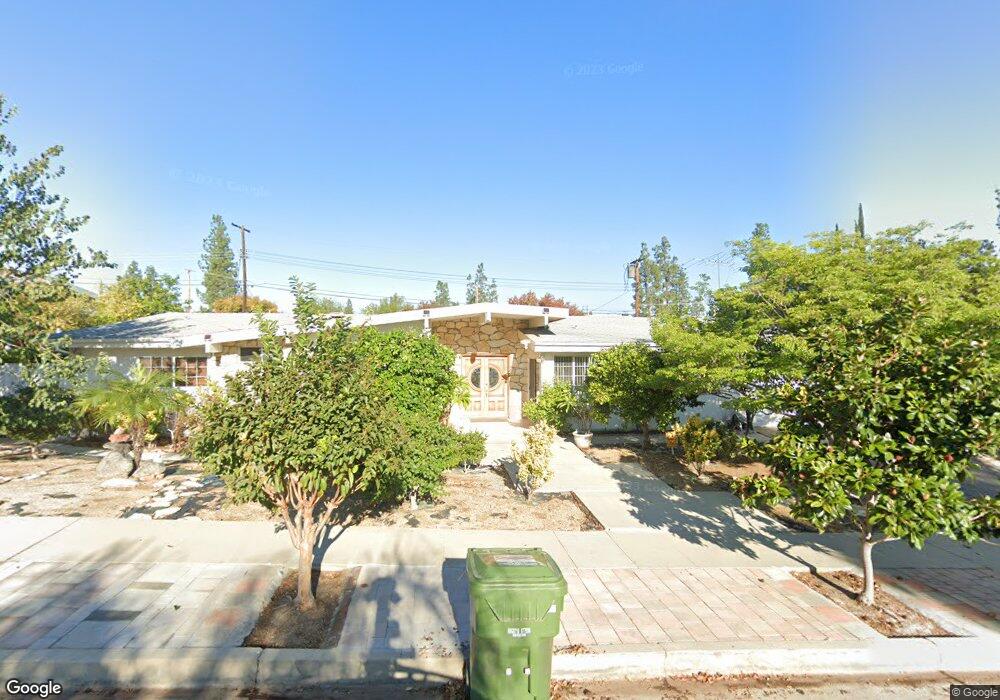
5311 Manton Ave Woodland Hills, CA 91367
Estimated Value: $1,550,000 - $1,739,635
4
Beds
3
Baths
2,580
Sq Ft
$638/Sq Ft
Est. Value
About This Home
This home is located at 5311 Manton Ave, Woodland Hills, CA 91367 and is currently estimated at $1,646,159, approximately $638 per square foot. 5311 Manton Ave is a home located in Los Angeles County with nearby schools including Woodlake Elementary Community Charter, Lockhurst Drive Charter Elementary, and Haynes Charter For Enriched Studies.
Ownership History
Date
Name
Owned For
Owner Type
Purchase Details
Closed on
Mar 19, 2019
Sold by
Hoang Quinn and Hoang Lienhua
Bought by
Hoang Quinn The and Hoang Lienhua My
Current Estimated Value
Purchase Details
Closed on
Sep 28, 2000
Sold by
Schuitevoerder Neil
Bought by
Hoang Quinn and Hoang Lienhua
Home Financials for this Owner
Home Financials are based on the most recent Mortgage that was taken out on this home.
Original Mortgage
$247,000
Interest Rate
7.82%
Purchase Details
Closed on
Jul 5, 1994
Sold by
Lee Banghyung and Lee Sookyoung
Bought by
Schuitevoerder Neil
Home Financials for this Owner
Home Financials are based on the most recent Mortgage that was taken out on this home.
Original Mortgage
$202,000
Interest Rate
8.57%
Create a Home Valuation Report for This Property
The Home Valuation Report is an in-depth analysis detailing your home's value as well as a comparison with similar homes in the area
Home Values in the Area
Average Home Value in this Area
Purchase History
| Date | Buyer | Sale Price | Title Company |
|---|---|---|---|
| Hoang Quinn The | -- | None Available | |
| Hoang Quinn | $347,000 | American Title Co | |
| Schuitevoerder Neil | -- | American Title Co | |
| Schuitevoerder Neil | $253,000 | United Title Company |
Source: Public Records
Mortgage History
| Date | Status | Borrower | Loan Amount |
|---|---|---|---|
| Previous Owner | Hoang Quinn | $247,000 | |
| Previous Owner | Schuitevoerder Neil | $202,000 |
Source: Public Records
Tax History Compared to Growth
Tax History
| Year | Tax Paid | Tax Assessment Tax Assessment Total Assessment is a certain percentage of the fair market value that is determined by local assessors to be the total taxable value of land and additions on the property. | Land | Improvement |
|---|---|---|---|---|
| 2025 | $7,212 | $567,258 | $373,838 | $193,420 |
| 2024 | $7,212 | $556,136 | $366,508 | $189,628 |
| 2023 | $7,079 | $545,232 | $359,322 | $185,910 |
| 2022 | $6,765 | $534,542 | $352,277 | $182,265 |
| 2021 | $6,674 | $524,062 | $345,370 | $178,692 |
| 2019 | $6,482 | $508,520 | $335,127 | $173,393 |
| 2018 | $6,265 | $498,550 | $328,556 | $169,994 |
| 2016 | $5,971 | $479,193 | $315,799 | $163,394 |
| 2015 | $5,886 | $471,996 | $311,056 | $160,940 |
| 2014 | $5,912 | $462,751 | $304,963 | $157,788 |
Source: Public Records
Map
Nearby Homes
- 23721 Mariano St
- 23701 Clarendon St
- 23623 Ladrillo St
- 5320 Orrville Ave
- 23761 Ladrillo St
- 23442 Burbank Blvd
- 5622 Le Sage Ave
- 5547 Paradise Valley Rd
- 23717 Crosson Dr
- 5546 Paradise Valley Rd
- 23246 Canzonet St
- 23248 Canzonet St
- 23346 Collins St
- 23340 Collins St
- 23621 Long Valley Rd
- 23242 Burbank Blvd
- 23245 Gonzales Dr
- 5534 Pattilar Ave
- 23853 Hatteras St
- 23615 Long Valley Rd
- 5323 Manton Ave
- 5301 Manton Ave
- 23626 Mariano St
- 5312 Manton Ave
- 23616 Mariano St
- 23636 Mariano St
- 5310 Manton Ave
- 5320 Manton Ave
- 5335 Manton Ave
- 5300 Manton Ave
- 5330 Manton Ave
- 5311 Dubois Ave
- 5301 Dubois Ave
- 5338 Manton Ave
- 5331 Dubois Ave
- 23631 Kiruna Place
- 23700 Mariano St
- 23630 Kiruna Place
- 5341 Dubois Ave
- 5351 Dubois Ave