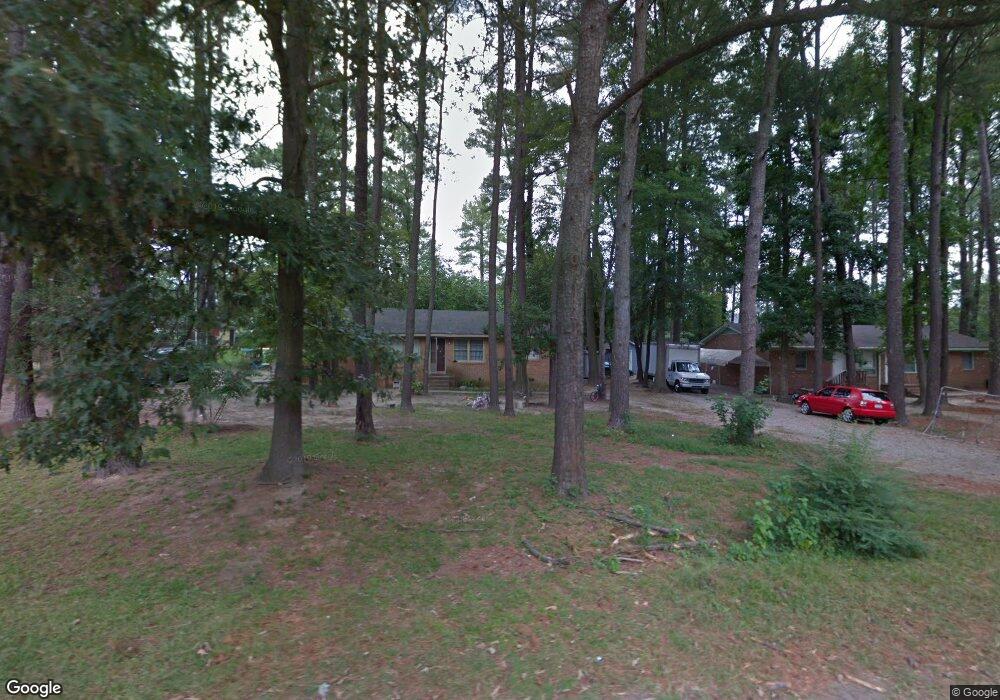
5311 Nancy St Raleigh, NC 27610
Southeast Raleigh NeighborhoodEstimated Value: $263,435 - $534,000
Studio
1
Bath
1,664
Sq Ft
$241/Sq Ft
Est. Value
About This Home
This home is located at 5311 Nancy St, Raleigh, NC 27610 and is currently estimated at $400,812, approximately $240 per square foot. 5311 Nancy St is a home located in Wake County with nearby schools including Rogers Lane Elementary, River Bend Middle, and Knightdale High.
Ownership History
Date
Name
Owned For
Owner Type
Purchase Details
Closed on
Jan 5, 2021
Sold by
Lino Jorge Zungia and De Jesus Moreno
Bought by
J Properties Trust
Current Estimated Value
Purchase Details
Closed on
Apr 10, 2019
Sold by
Zuniga Jose Juan
Bought by
Lino Jorge Zuniga and Dejesus Moreno Perez
Purchase Details
Closed on
Sep 30, 2016
Sold by
Lina Jorge Zuhiga and Moreno Perez Maria De Jesus
Bought by
J And M Properties Land Trust
Purchase Details
Closed on
Sep 8, 2016
Sold by
Raleigh Projects Llc
Bought by
Zuniga Jose Jaun
Purchase Details
Closed on
Jun 10, 2014
Sold by
Zulu Property Investments Llc
Bought by
Raleigh Projects Llc
Purchase Details
Closed on
Dec 29, 2011
Sold by
Koe Krompecher Pablo
Bought by
Zulu Property Investments Llc
Purchase Details
Closed on
May 9, 2011
Sold by
Jones Lucius S
Bought by
Koe Krompecher Pablo
Create a Home Valuation Report for This Property
The Home Valuation Report is an in-depth analysis detailing your home's value as well as a comparison with similar homes in the area
Home Values in the Area
Average Home Value in this Area
Purchase History
| Date | Buyer | Sale Price | Title Company |
|---|---|---|---|
| J Properties Trust | -- | None Available | |
| M And J Properties Trust | -- | None Available | |
| Lino Jorge Zuniga | -- | None Available | |
| Lino Jorge Zuniga | -- | None Listed On Document | |
| J And M Properties Land Trust | -- | None Available | |
| Zuniga Jose Jaun | $105,000 | None Available | |
| Raleigh Projects Llc | $94,000 | None Available | |
| Zulu Property Investments Llc | -- | None Available | |
| Koe Krompecher Pablo | $274,000 | None Available |
Source: Public Records
Tax History
| Year | Tax Paid | Tax Assessment Tax Assessment Total Assessment is a certain percentage of the fair market value that is determined by local assessors to be the total taxable value of land and additions on the property. | Land | Improvement |
|---|---|---|---|---|
| 2025 | $1,577 | $240,372 | $75,000 | $165,372 |
| 2024 | $1,533 | $240,372 | $75,000 | $165,372 |
Source: Public Records
Map
Nearby Homes
- 1201 Kavkaz St
- 1237 Swingline Way
- 4801 Tanglewood Oaks St
- 4805 Tanglewood Oaks St
- 5121 Jimmy Ridge Place
- 5125 Mass Rock Dr
- 5103 Jimmy Ridge Place
- 5100 Mass Rock Dr
- 5520 Bellcamp Ct
- 5011 Eagle Stone Ln Unit 106
- 5709 Angelfish Ct
- 1916 Riverknoll Dr
- 1071 Heritage Manor Dr
- 1220 Canyon Rock Ct Unit 107
- 1301 Stone Manor Dr
- 1932 Ranch Mill Cir
- 1656 Goldfinch Perch Ln
- 1660 Goldfinch Perch Ln
- 1632 Goldfinch Perch Ln
- 1664 Goldfinch Perch Ln
Your Personal Tour Guide
Ask me questions while you tour the home.