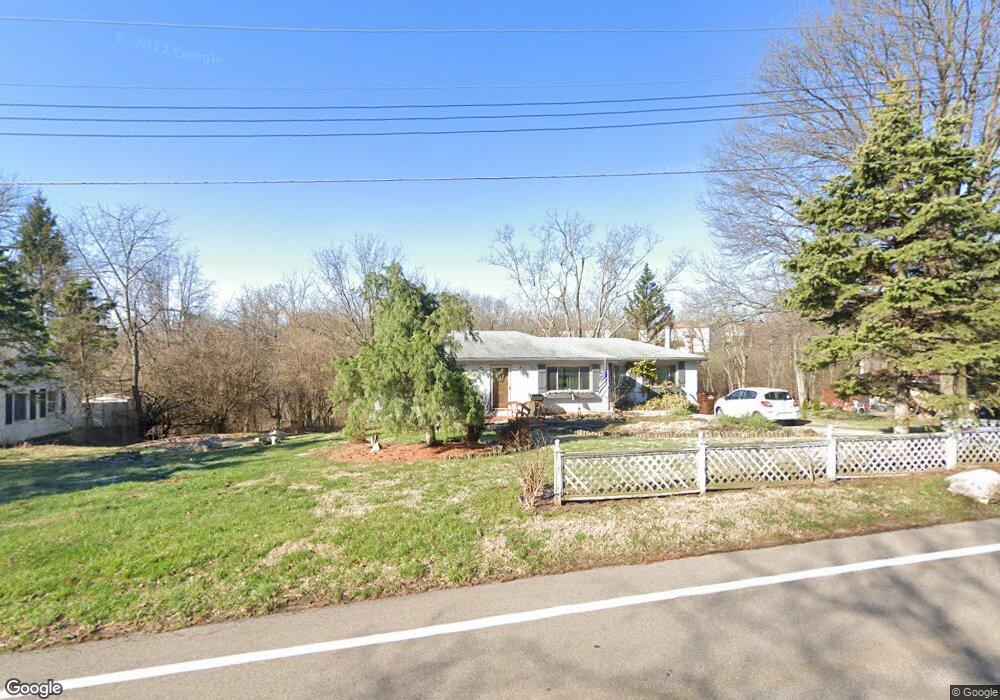
5311 Old Blue Rock Rd Cincinnati, OH 45247
Estimated Value: $131,000 - $366,000
3
Beds
2
Baths
1,408
Sq Ft
$163/Sq Ft
Est. Value
About This Home
This home is located at 5311 Old Blue Rock Rd, Cincinnati, OH 45247 and is currently estimated at $229,997, approximately $163 per square foot. 5311 Old Blue Rock Rd is a home located in Hamilton County with nearby schools including Colerain Elementary School, Colerain Middle School, and Colerain High School.
Ownership History
Date
Name
Owned For
Owner Type
Purchase Details
Closed on
Mar 3, 2021
Sold by
Overstreet Connie Jean
Bought by
Balvino Alferdo Juarez and Leon Adriana Cantero
Current Estimated Value
Purchase Details
Closed on
Nov 7, 2019
Sold by
Estate Of Jerome P D Amico
Bought by
Overstreet Connie Jean
Purchase Details
Closed on
Feb 8, 1996
Sold by
Dooley Agnes D
Bought by
Damico Jerome P
Home Financials for this Owner
Home Financials are based on the most recent Mortgage that was taken out on this home.
Original Mortgage
$69,500
Interest Rate
7.07%
Purchase Details
Closed on
Sep 6, 1994
Sold by
Beeler Stanley J and Beeler Ursula M
Bought by
Damico Jerome P and Dooley Agnes D
Home Financials for this Owner
Home Financials are based on the most recent Mortgage that was taken out on this home.
Original Mortgage
$71,000
Interest Rate
8.53%
Create a Home Valuation Report for This Property
The Home Valuation Report is an in-depth analysis detailing your home's value as well as a comparison with similar homes in the area
Home Values in the Area
Average Home Value in this Area
Purchase History
| Date | Buyer | Sale Price | Title Company |
|---|---|---|---|
| Balvino Alferdo Juarez | $92,500 | Chicago Title Company Llc | |
| Overstreet Connie Jean | -- | None Available | |
| Damico Jerome P | -- | -- | |
| Damico Jerome P | -- | -- |
Source: Public Records
Mortgage History
| Date | Status | Borrower | Loan Amount |
|---|---|---|---|
| Previous Owner | Damico Jerome P | $69,500 | |
| Previous Owner | Damico Jerome P | $71,000 |
Source: Public Records
Tax History Compared to Growth
Tax History
| Year | Tax Paid | Tax Assessment Tax Assessment Total Assessment is a certain percentage of the fair market value that is determined by local assessors to be the total taxable value of land and additions on the property. | Land | Improvement |
|---|---|---|---|---|
| 2024 | $2,424 | $31,014 | $16,503 | $14,511 |
| 2023 | $2,434 | $31,014 | $16,503 | $14,511 |
| 2022 | $4,057 | $50,040 | $15,579 | $34,461 |
| 2021 | $4,028 | $50,040 | $15,579 | $34,461 |
| 2020 | $4,063 | $50,040 | $15,579 | $34,461 |
| 2019 | $3,759 | $42,406 | $13,202 | $29,204 |
| 2018 | $2,693 | $42,406 | $13,202 | $29,204 |
| 2017 | $2,551 | $42,406 | $13,202 | $29,204 |
| 2016 | $2,416 | $39,610 | $13,188 | $26,422 |
| 2015 | $2,439 | $39,610 | $13,188 | $26,422 |
| 2014 | $2,443 | $39,610 | $13,188 | $26,422 |
| 2013 | $2,447 | $41,692 | $13,881 | $27,811 |
Source: Public Records
Map
Nearby Homes
- 4893 Blue Meadow Ln
- 5658 Springdale Rd
- 5410 Desertgold Dr
- 5778 Blue Rock Hill Rd
- 8211 Fawn Lake Ct
- 8713 Wuest Rd
- 8530 Wuest Rd
- 4151 Poole Rd
- 3960 Olde Savannah Dr
- 3950 Olde Savannah Dr
- 0 Thompson Rd Unit 1833173
- 3757 Donata Dr
- 3951 Springrock Dr
- 3663 Sandralin Dr
- 4527 Hanley Rd
- 4029 Appletree Ct
- 4538 Philnoll Dr
- 5591 Squirrel Run
- 8747 Cheviot Rd
- 3701 W Galbraith Rd
- 5311 Old Blue Rock Rd
- 5315 Old Blue Rock Rd
- 5305 Old Blue Rock Rd
- 5293 Old Blue Rock Rd
- 5293 Blue Rock Rd
- 5319 Blue Rock Rd
- 5277 Blue Rock Rd
- 5255 Old Blue Rock Rd
- 5323 Blue Rock Rd
- 5250 Old Blue Rock Rd
- 5233 Old Blue Rock Rd
- 5240 Old Blue Rock Rd
- 5327 Old Blue Rock Rd
- 5609 Old Blue Rock Rd Unit 25
- 5607 Old Blue Rock Rd Unit 23
- 5613 Old Blue Rock Rd
- 5611 Old Blue Rock Rd
- 5613 Old Blue Rock Rd Unit 26
- 5230 Old Blue Rock Rd
- 5621 Old Blue Rock Rd Unit 30