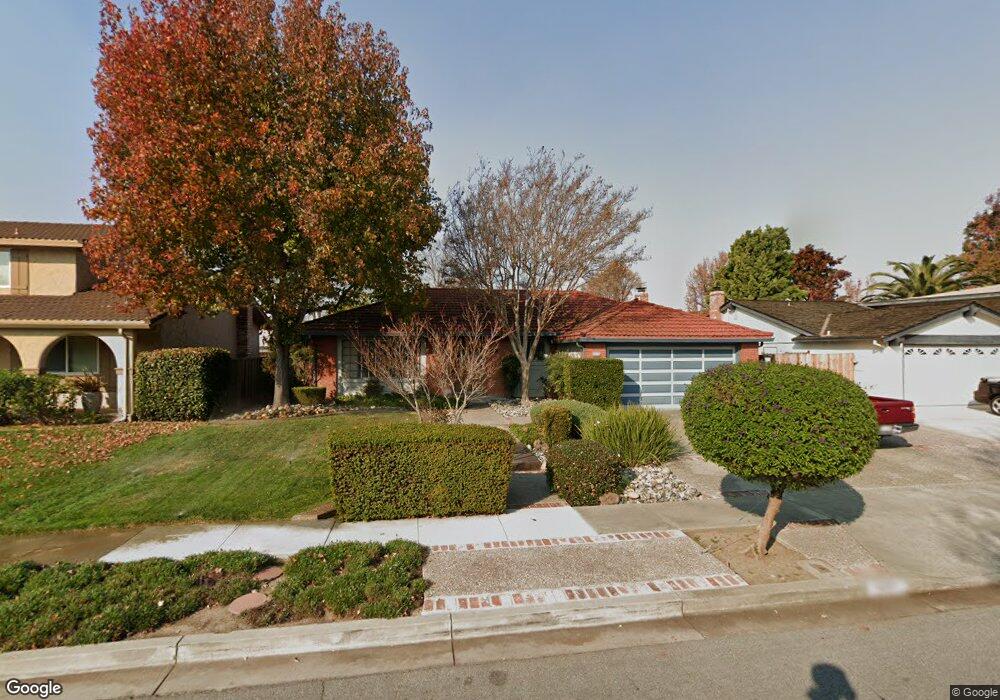
5311 Surrey Ct Newark, CA 94560
Estimated Value: $1,504,675 - $1,617,000
About This Home
This home is located at 5311 Surrey Ct, Newark, CA 94560 and is currently estimated at $1,540,919, approximately $778 per square foot. 5311 Surrey Ct is a home located in Alameda County with nearby schools including John F. Kennedy Elementary School, Newark Junior High School, and Newark Memorial High School.
Ownership History
We collect this data history from publicly available records. To have your information removed, we recommend requesting removal directly through your county’s website.
Purchase Details
Home Financials for this Owner
Home Financials are based on the most recent Mortgage that was taken out on this home.Home Values in the Area
Average Home Value in this Area
Purchase History
We collect this data history from publicly available records. To have your information removed, we recommend requesting removal directly through your county’s website.
| Date | Buyer | Sale Price | Title Company |
|---|---|---|---|
| -- | Old Republic Title Company | ||
| -- | Old Republic Title Company | ||
| -- | Old Republic Title Company |
Mortgage History
We collect this data history from publicly available records. To have your information removed, we recommend requesting removal directly through your county’s website.
| Date | Status | Borrower | Loan Amount |
|---|---|---|---|
| Closed | $160,000 |
Tax History
We collect this data history from publicly available records. To have your information removed, we recommend requesting removal directly through your county’s website.
| Year | Tax Paid | Tax Assessment Tax Assessment Total Assessment is a certain percentage of the fair market value that is determined by local assessors to be the total taxable value of land and additions on the property. | Land | Improvement |
|---|---|---|---|---|
| 2025 | $4,792 | $354,801 | $169,070 | $192,731 |
| 2024 | $4,792 | $347,707 | $165,755 | $188,952 |
| 2023 | $4,650 | $347,753 | $162,505 | $185,248 |
| 2022 | $4,571 | $333,935 | $159,319 | $181,616 |
| 2021 | $4,460 | $327,251 | $156,196 | $178,055 |
| 2020 | $4,355 | $330,823 | $154,594 | $176,229 |
| 2019 | $4,295 | $324,337 | $151,563 | $172,774 |
| 2018 | $4,226 | $317,979 | $148,592 | $169,387 |
| 2017 | $4,118 | $311,745 | $145,679 | $166,066 |
| 2016 | $4,066 | $305,633 | $142,823 | $162,810 |
| 2015 | $4,051 | $301,043 | $140,678 | $160,365 |
| 2014 | $3,937 | $295,146 | $137,922 | $157,224 |
Map
- 5298 Sussex Place
- 36276 Cedar Blvd
- 36274 Salisbury Dr
- 36288 Tudor Place
- 35547 Blackburn Dr
- 36005 Rosewood Dr
- 36234 Worthing Dr
- 36057 Dalewood Dr
- 35345 Cheviot Ct
- 35415 Blackburn Dr
- 36262 San Pedro Dr
- 36023 Pizarro Dr
- 5358 Port Sailwood Dr Unit 34
- 36719 Port Tidewood St
- 36637 Burdick St
- 36122 Magellan Dr
- 35279 Farnham Dr
- 5613 Abington Ct
- 4708 Portola Dr
- 4742 El Rey Ave
- 5307 Yarmouth Ct
- 5315 Yarmouth Ct
- 5310 Cambridge Ct
- 5318 Cambridge Ct
- 5323 Yarmouth Ct
- 5295 Bristol Place
- 5306 Yarmouth Ct
- 5326 Cambridge Ct
- 5314 Yarmouth Ct
- 5290 Salisbury Dr
- 5331 Yarmouth Ct
- 5322 Yarmouth Ct
- 5294 Bristol Place
- 5334 Cambridge Ct
- 5283 Bristol Place
- 5278 Salisbury Dr
- 5303 Surrey Ct
- 5330 Yarmouth Ct
- 5311 Cambridge Ct
- 5319 Cambridge Ct
Ask me questions while you tour the home.