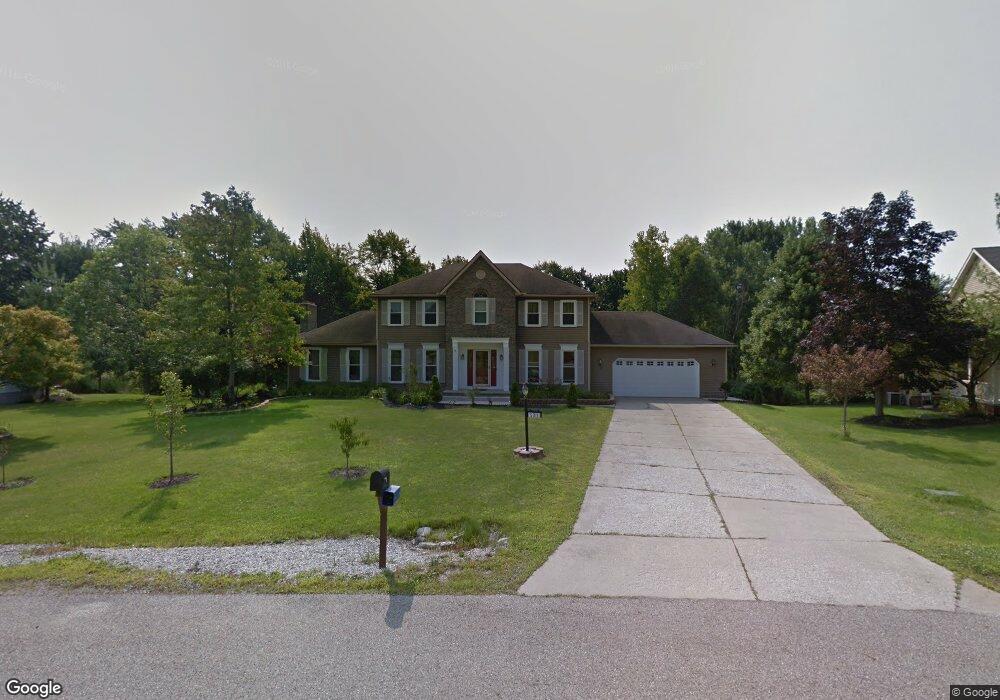
5311 Towbridge Dr Hudson, OH 44236
Estimated Value: $410,000 - $524,000
4
Beds
3
Baths
2,612
Sq Ft
$182/Sq Ft
Est. Value
About This Home
This home is located at 5311 Towbridge Dr, Hudson, OH 44236 and is currently estimated at $475,309, approximately $181 per square foot. 5311 Towbridge Dr is a home located in Summit County with nearby schools including Ellsworth Hill Elementary School, East Woods Intermediate School, and Hudson Middle School.
Ownership History
Date
Name
Owned For
Owner Type
Purchase Details
Closed on
Aug 31, 2021
Sold by
Hashem Abul
Bought by
Hashem Abul and Khatun Hajara
Current Estimated Value
Purchase Details
Closed on
Oct 27, 2012
Sold by
Paler Peggy A
Bought by
Hashem Abul
Purchase Details
Closed on
Jun 28, 2006
Sold by
Murphy Robert and Murphy Rosemary
Bought by
Ensminger J Brian and Paler Peggy Ann
Home Financials for this Owner
Home Financials are based on the most recent Mortgage that was taken out on this home.
Original Mortgage
$189,600
Interest Rate
6.72%
Mortgage Type
Purchase Money Mortgage
Purchase Details
Closed on
Jul 19, 2002
Sold by
Rollins Claude M
Bought by
Murphy Robert
Home Financials for this Owner
Home Financials are based on the most recent Mortgage that was taken out on this home.
Original Mortgage
$285,000
Interest Rate
6.8%
Create a Home Valuation Report for This Property
The Home Valuation Report is an in-depth analysis detailing your home's value as well as a comparison with similar homes in the area
Home Values in the Area
Average Home Value in this Area
Purchase History
| Date | Buyer | Sale Price | Title Company |
|---|---|---|---|
| Hashem Abul | -- | None Available | |
| Hashem Abul | $147,000 | None Available | |
| Ensminger J Brian | $237,000 | None Available | |
| Murphy Robert | $215,200 | -- |
Source: Public Records
Mortgage History
| Date | Status | Borrower | Loan Amount |
|---|---|---|---|
| Previous Owner | Ensminger J Brian | $189,600 | |
| Previous Owner | Murphy Robert | $285,000 |
Source: Public Records
Tax History Compared to Growth
Tax History
| Year | Tax Paid | Tax Assessment Tax Assessment Total Assessment is a certain percentage of the fair market value that is determined by local assessors to be the total taxable value of land and additions on the property. | Land | Improvement |
|---|---|---|---|---|
| 2025 | $7,146 | $140,326 | $21,980 | $118,346 |
| 2024 | $7,146 | $140,326 | $21,980 | $118,346 |
| 2023 | $7,146 | $140,326 | $21,980 | $118,346 |
| 2022 | $6,732 | $117,979 | $18,470 | $99,509 |
| 2021 | $6,744 | $117,979 | $18,470 | $99,509 |
| 2020 | $6,625 | $117,980 | $18,470 | $99,510 |
| 2019 | $5,757 | $94,780 | $18,470 | $76,310 |
| 2018 | $5,736 | $94,780 | $18,470 | $76,310 |
| 2017 | $5,428 | $94,780 | $18,470 | $76,310 |
| 2016 | $5,467 | $87,140 | $18,470 | $68,670 |
| 2015 | $5,428 | $87,140 | $18,470 | $68,670 |
| 2014 | $5,444 | $87,140 | $18,470 | $68,670 |
| 2013 | $5,746 | $74,910 | $18,470 | $56,440 |
Source: Public Records
Map
Nearby Homes
- 0 Lincoln Blvd
- 5469 Sullivan Rd
- 5491 Sullivan Rd
- 4959 Hudson Dr
- 5532 Hudson Dr
- 4844 State Rd
- 4850 State Rd
- HOLLISTER Plan at Reserve at Boulder Estates
- ALDEN Plan at Reserve at Boulder Estates
- PARKETTE Plan at Reserve at Boulder Estates
- BELLEVILLE Plan at Reserve at Boulder Estates
- VANDERBURGH Plan at Reserve at Boulder Estates
- BUCHANAN Plan at Reserve at Boulder Estates
- BEACHWOOD Plan at Reserve at Boulder Estates
- 166 W Barlow Rd
- 28 Boulder Blvd
- 52 Boulder Blvd
- 6170 Nicholson Dr
- V/L Diplomat Dr
- 4839 Lake View Dr
- 5325 Towbridge Dr
- 5299 Towbridge Dr
- 5341 Towbridge Dr
- 5333 Towbridge Dr
- 5285 Towbridge Dr
- 5346 Port Chester Dr
- 5328 Towbridge Dr
- 5277 Towbridge Dr
- 5356 Port Chester Dr
- 5355 Towbridge Dr
- 5269 Towbridge Dr
- 5375 Port Chester Dr
- 5366 Port Chester Dr
- 5348 Towbridge Dr
- 5238 Towbridge Dr
- 5230 Towbridge Dr
- 5376 Port Chester Dr
- 5387 Port Chester Dr
- 5363 Towbridge Dr
- 5360 Towbridge Dr