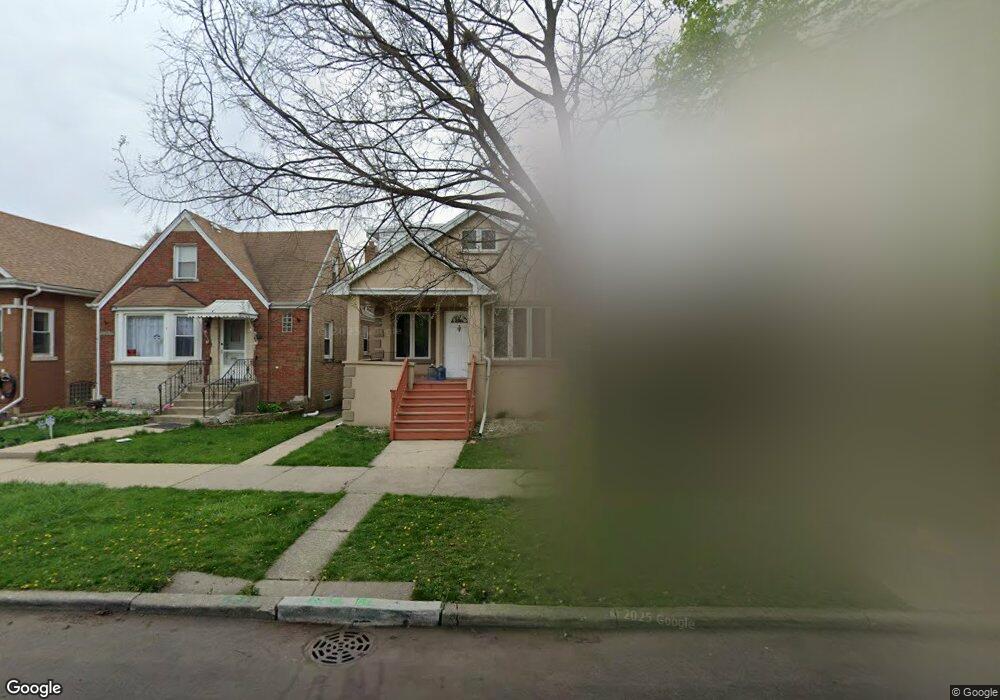
5311 W Fletcher St Chicago, IL 60641
Cragin NeighborhoodEstimated Value: $414,852 - $440,000
6
Beds
3
Baths
1,844
Sq Ft
$231/Sq Ft
Est. Value
About This Home
This home is located at 5311 W Fletcher St, Chicago, IL 60641 and is currently estimated at $425,713, approximately $230 per square foot. 5311 W Fletcher St is a home located in Cook County with nearby schools including Camras Elementary School, Foreman College and Career Academy, and St Ferdinand Parish School.
Ownership History
Date
Name
Owned For
Owner Type
Purchase Details
Closed on
Oct 27, 2016
Sold by
Montes Israel and Montes Elisa
Bought by
Zamarron Lennis and Dial Rigoberto
Current Estimated Value
Home Financials for this Owner
Home Financials are based on the most recent Mortgage that was taken out on this home.
Original Mortgage
$255,189
Outstanding Balance
$203,767
Interest Rate
3.25%
Mortgage Type
FHA
Estimated Equity
$221,946
Purchase Details
Closed on
Jul 17, 2002
Sold by
Nachman Adam and Nachman Sylwestra
Bought by
Montes Israel and Montes Elisa
Home Financials for this Owner
Home Financials are based on the most recent Mortgage that was taken out on this home.
Original Mortgage
$158,000
Interest Rate
6.79%
Purchase Details
Closed on
Aug 31, 1999
Sold by
Cosmopolitan Bank & Trust
Bought by
Nachman Adam and Nachman Sylwestra
Home Financials for this Owner
Home Financials are based on the most recent Mortgage that was taken out on this home.
Original Mortgage
$116,800
Interest Rate
7.5%
Create a Home Valuation Report for This Property
The Home Valuation Report is an in-depth analysis detailing your home's value as well as a comparison with similar homes in the area
Home Values in the Area
Average Home Value in this Area
Purchase History
| Date | Buyer | Sale Price | Title Company |
|---|---|---|---|
| Zamarron Lennis | $260,000 | Heritage Title Company | |
| Montes Israel | $260,000 | Stewart Title | |
| Nachman Adam | $146,000 | Professional National Title |
Source: Public Records
Mortgage History
| Date | Status | Borrower | Loan Amount |
|---|---|---|---|
| Open | Zamarron Lennis | $255,189 | |
| Previous Owner | Montes Israel | $158,000 | |
| Previous Owner | Nachman Adam | $116,800 |
Source: Public Records
Tax History Compared to Growth
Tax History
| Year | Tax Paid | Tax Assessment Tax Assessment Total Assessment is a certain percentage of the fair market value that is determined by local assessors to be the total taxable value of land and additions on the property. | Land | Improvement |
|---|---|---|---|---|
| 2024 | $3,945 | $33,001 | $6,938 | $26,063 |
| 2023 | $3,824 | $22,000 | $5,625 | $16,375 |
| 2022 | $3,824 | $22,000 | $5,625 | $16,375 |
| 2021 | $3,757 | $22,003 | $5,628 | $16,375 |
| 2020 | $3,831 | $20,291 | $4,687 | $15,604 |
| 2019 | $4,146 | $24,054 | $4,687 | $19,367 |
| 2018 | $4,075 | $24,054 | $4,687 | $19,367 |
| 2017 | $5,258 | $24,412 | $4,125 | $20,287 |
| 2016 | $4,892 | $24,412 | $4,125 | $20,287 |
| 2015 | $3,108 | $24,412 | $4,125 | $20,287 |
| 2014 | $3,082 | $21,502 | $3,750 | $17,752 |
| 2013 | $3,093 | $21,502 | $3,750 | $17,752 |
Source: Public Records
Map
Nearby Homes
- 5335 W Barry Ave
- 3036 N Long Ave
- 5244 W Barry Ave
- 2939 N Lotus Ave
- 3043 N Laramie Ave Unit 2
- 3045 N Laramie Ave Unit 2
- 5243 W Oakdale Ave
- 5435 W Melrose St
- 5303 W George St
- 3036 N Luna Ave
- 5254 W Wolfram St
- 5038 W Nelson St
- 5041 W Fletcher St
- 5042 W Wellington Ave
- 4918-22 W Diversey Ave
- 5021 W Nelson St
- 5121 W Henderson St
- 5155 W Roscoe St
- 5233 W Parker Ave
- 5121 W Diversey Ave Unit 3N
- 5315 W Fletcher St
- 5307 W Fletcher St
- 5317 W Fletcher St
- 5305 W Fletcher St
- 5321 W Fletcher St
- 5301 W Fletcher St
- 5323 W Fletcher St
- 3112 N Lockwood Ave
- 3112 N Lockwood Ave Unit 3112
- 3112 N Lockwood Ave Unit B
- 5312 W Barry Ave
- 5306 W Barry Ave
- 5325 W Fletcher St
- 5316 W Barry Ave
- 5304 W Barry Ave
- 5310 W Barry Ave
- 5310 W Barry Ave Unit G
- 5318 W Barry Ave
- 3110 N Lockwood Ave Unit 1N
- 3110 N Lockwood Ave