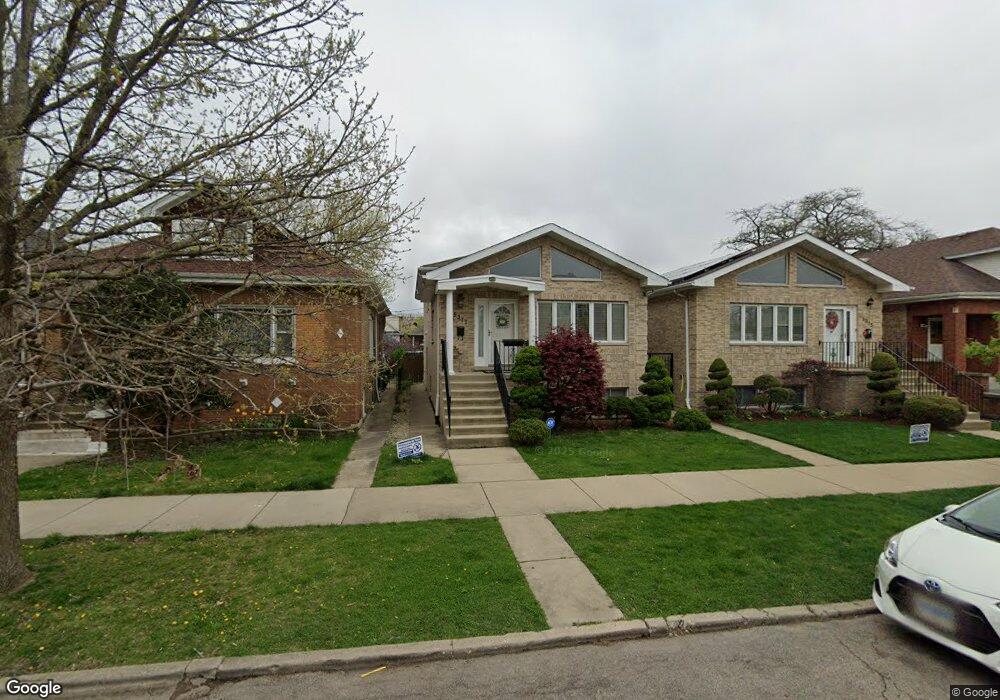
5311 W Nelson St Chicago, IL 60641
Cragin NeighborhoodEstimated Value: $345,000 - $488,000
3
Beds
3
Baths
1,320
Sq Ft
$333/Sq Ft
Est. Value
About This Home
This home is located at 5311 W Nelson St, Chicago, IL 60641 and is currently estimated at $439,072, approximately $332 per square foot. 5311 W Nelson St is a home located in Cook County with nearby schools including Camras Elementary School, Foreman College and Career Academy, and Christopher House.
Ownership History
Date
Name
Owned For
Owner Type
Purchase Details
Closed on
Jul 31, 2007
Sold by
Velez Genoveva
Bought by
Velez Jose and Velez Genoveva
Current Estimated Value
Home Financials for this Owner
Home Financials are based on the most recent Mortgage that was taken out on this home.
Original Mortgage
$375,000
Outstanding Balance
$238,037
Interest Rate
6.71%
Mortgage Type
New Conventional
Estimated Equity
$201,035
Purchase Details
Closed on
Jul 13, 2004
Sold by
Lynch Patrick K
Bought by
Velez Genoveva
Home Financials for this Owner
Home Financials are based on the most recent Mortgage that was taken out on this home.
Original Mortgage
$200,000
Interest Rate
6.35%
Mortgage Type
Unknown
Purchase Details
Closed on
Nov 26, 2002
Sold by
Roman Cesar
Bought by
Lynch Patrick K
Home Financials for this Owner
Home Financials are based on the most recent Mortgage that was taken out on this home.
Original Mortgage
$148,000
Interest Rate
4.25%
Purchase Details
Closed on
Mar 28, 2000
Sold by
Walsh Mary B
Bought by
Roman Cesar
Home Financials for this Owner
Home Financials are based on the most recent Mortgage that was taken out on this home.
Original Mortgage
$108,960
Interest Rate
3.95%
Create a Home Valuation Report for This Property
The Home Valuation Report is an in-depth analysis detailing your home's value as well as a comparison with similar homes in the area
Home Values in the Area
Average Home Value in this Area
Purchase History
| Date | Buyer | Sale Price | Title Company |
|---|---|---|---|
| Velez Jose | -- | Ctic | |
| Velez Genoveva | $400,000 | Atgf Inc | |
| Lynch Patrick K | $185,000 | -- | |
| Roman Cesar | $136,500 | -- |
Source: Public Records
Mortgage History
| Date | Status | Borrower | Loan Amount |
|---|---|---|---|
| Open | Velez Jose | $375,000 | |
| Closed | Velez Genoveva | $200,000 | |
| Previous Owner | Lynch Patrick K | $148,000 | |
| Previous Owner | Roman Cesar | $108,960 |
Source: Public Records
Tax History Compared to Growth
Tax History
| Year | Tax Paid | Tax Assessment Tax Assessment Total Assessment is a certain percentage of the fair market value that is determined by local assessors to be the total taxable value of land and additions on the property. | Land | Improvement |
|---|---|---|---|---|
| 2024 | $6,341 | $42,001 | $6,938 | $35,063 |
| 2023 | $6,142 | $36,000 | $5,625 | $30,375 |
| 2022 | $6,142 | $36,000 | $5,625 | $30,375 |
| 2021 | $6,038 | $36,003 | $5,628 | $30,375 |
| 2020 | $5,645 | $30,909 | $4,687 | $26,222 |
| 2019 | $6,292 | $34,730 | $4,687 | $30,043 |
| 2018 | $6,185 | $34,730 | $4,687 | $30,043 |
| 2017 | $6,118 | $31,779 | $4,125 | $27,654 |
| 2016 | $6,573 | $35,294 | $4,125 | $31,169 |
| 2015 | $5,990 | $35,294 | $4,125 | $31,169 |
| 2014 | $5,531 | $32,355 | $3,750 | $28,605 |
| 2013 | $5,410 | $32,355 | $3,750 | $28,605 |
Source: Public Records
Map
Nearby Homes
- 5335 W Barry Ave
- 3036 N Long Ave
- 2939 N Lotus Ave
- 5244 W Barry Ave
- 5243 W Oakdale Ave
- 5303 W George St
- 3043 N Laramie Ave Unit 2
- 3045 N Laramie Ave Unit 2
- 5254 W Wolfram St
- 3036 N Luna Ave
- 5435 W Melrose St
- 4918-22 W Diversey Ave
- 5042 W Wellington Ave
- 5038 W Nelson St
- 5041 W Fletcher St
- 5233 W Parker Ave
- 5021 W Nelson St
- 5121 W Diversey Ave Unit 3N
- 5121 W Diversey Ave Unit 3S
- 5505 W Parker Ave
- 5313 W Nelson St
- 5307 W Nelson St
- 5317 W Nelson St
- 5305 W Nelson St
- 5319 W Nelson St
- 5301 W Nelson St
- 5323 W Nelson St
- 5310 W Wellington Ave
- 5312 W Wellington Ave
- 5308 W Wellington Ave
- 5325 W Nelson St
- 5304 W Wellington Ave
- 5316 W Wellington Ave
- 5316 W Wellington Ave
- 5355 W Wellington Ave Unit G
- 5318 W Wellington Ave
- 5300 W Wellington Ave
- 5312 W Nelson St
- 5306 W Nelson St Unit 1
- 5310 W Nelson St Unit 1