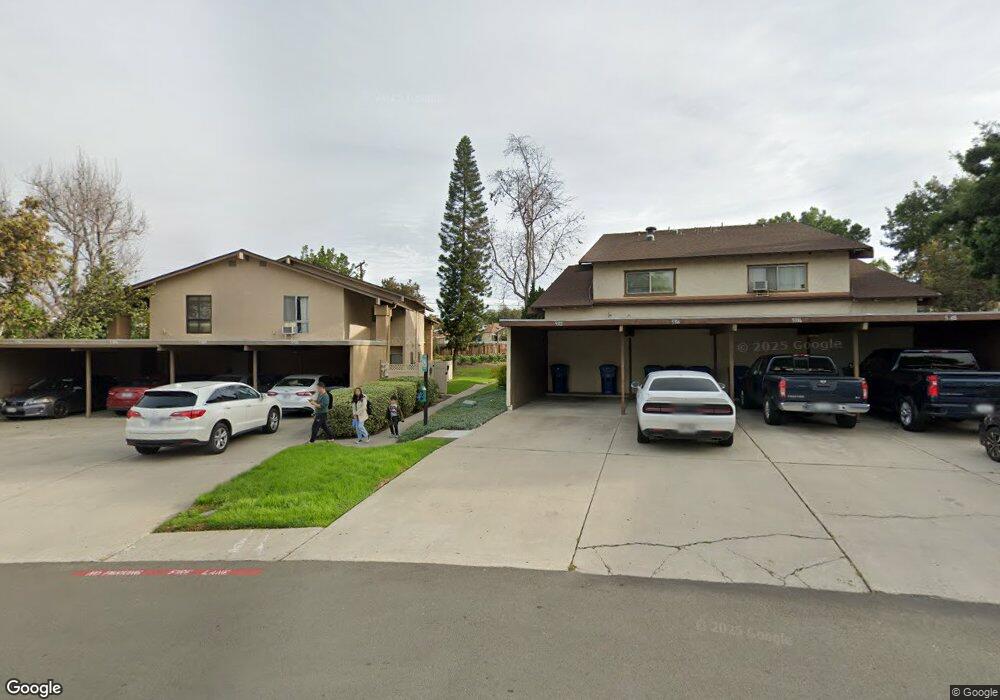
5312 Caminito Mindy Unit 23 San Diego, CA 92105
Oak Park NeighborhoodEstimated Value: $447,000 - $570,000
2
Beds
2
Baths
994
Sq Ft
$500/Sq Ft
Est. Value
About This Home
This home is located at 5312 Caminito Mindy Unit 23, San Diego, CA 92105 and is currently estimated at $497,352, approximately $500 per square foot. 5312 Caminito Mindy Unit 23 is a home located in San Diego County with nearby schools including Oak Park Elementary School, Mann Middle School, and Crawford High School.
Ownership History
Date
Name
Owned For
Owner Type
Purchase Details
Closed on
Sep 12, 2014
Sold by
Safe Capital Inc
Bought by
Ponce Mario and Ponce Mallissa
Current Estimated Value
Home Financials for this Owner
Home Financials are based on the most recent Mortgage that was taken out on this home.
Original Mortgage
$186,558
Outstanding Balance
$142,558
Interest Rate
4.09%
Mortgage Type
FHA
Estimated Equity
$354,794
Purchase Details
Closed on
Jan 20, 2011
Sold by
Greene Adia B
Bought by
Safe Capital Inc
Purchase Details
Closed on
Nov 15, 2001
Sold by
Dory Capital
Bought by
Greene Adia B
Home Financials for this Owner
Home Financials are based on the most recent Mortgage that was taken out on this home.
Original Mortgage
$131,920
Interest Rate
7.11%
Mortgage Type
FHA
Create a Home Valuation Report for This Property
The Home Valuation Report is an in-depth analysis detailing your home's value as well as a comparison with similar homes in the area
Home Values in the Area
Average Home Value in this Area
Purchase History
| Date | Buyer | Sale Price | Title Company |
|---|---|---|---|
| Ponce Mario | $190,000 | Ticor Title | |
| Safe Capital Inc | $88,000 | None Available | |
| Greene Adia B | $136,000 | Lawyers Title |
Source: Public Records
Mortgage History
| Date | Status | Borrower | Loan Amount |
|---|---|---|---|
| Open | Ponce Mario | $186,558 | |
| Previous Owner | Greene Adia B | $131,920 |
Source: Public Records
Tax History Compared to Growth
Tax History
| Year | Tax Paid | Tax Assessment Tax Assessment Total Assessment is a certain percentage of the fair market value that is determined by local assessors to be the total taxable value of land and additions on the property. | Land | Improvement |
|---|---|---|---|---|
| 2025 | $2,695 | $228,341 | $91,334 | $137,007 |
| 2024 | $2,695 | $223,865 | $89,544 | $134,321 |
| 2023 | $2,634 | $219,477 | $87,789 | $131,688 |
| 2022 | $2,563 | $215,174 | $86,068 | $129,106 |
| 2021 | $2,543 | $210,956 | $84,381 | $126,575 |
| 2020 | $2,512 | $208,794 | $83,516 | $125,278 |
| 2019 | $2,466 | $204,701 | $81,879 | $122,822 |
| 2018 | $2,322 | $200,688 | $80,274 | $120,414 |
| 2017 | $2,331 | $196,753 | $78,700 | $118,053 |
| 2016 | $2,293 | $192,896 | $77,157 | $115,739 |
| 2015 | $2,260 | $190,000 | $75,999 | $114,001 |
| 2014 | $1,261 | $104,511 | $41,804 | $62,707 |
Source: Public Records
Map
Nearby Homes
- 5233 Caminito Cachorro
- 2151 54th St
- 2215 Susan Place
- 0 Redwood St Unit IG25200939
- 2501 2503 Sumac Dr
- 5550 Grape St
- 4918 Dalehaven Place
- 5474 Streamview Dr
- 3416 Winlow St
- 5566 Streamview Dr
- 2003 Bayview Heights Dr Unit SPC 109
- 2003 Bayview Heights Dr Unit SPC 210
- 2003 Bayview Heights Dr Unit 157
- 2003 Bayview Heights Dr Unit SPC 180
- 2003 Bayview Heights Dr Unit 176
- 2003 Bayview Heights Dr Unit 83
- 5610 Streamview Dr
- 5426 Dwight St
- 2877 47th St
- 3636 Lemona Ave Unit B
- 5310 Caminito Mindy
- 5308 Caminito Mindy
- 5318 Caminito Mindy
- 5322 Caminito Mindy
- 5320 Caminito Mindy
- 5304 Caminito Mindy Unit 27
- 5306 Caminito Mindy
- 5326 Caminito Mindy
- 5324 Caminito Mindy
- 5327 Krenning St
- 5319 Krenning St
- 2877 53rd St
- 5328 Caminito Mindy
- 5335 Krenning St
- 5311 Krenning St
- 2873 53rd St
- 2875 53rd St
- 53rd St
- 2879 53rd St
- 5303 Caminito Mindy