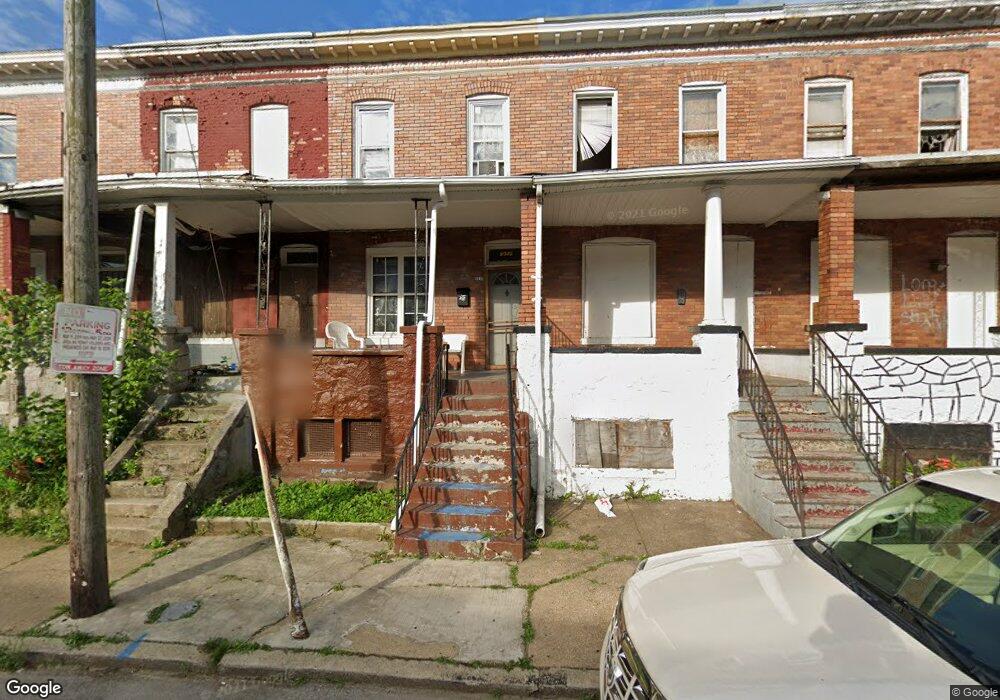
5312 Maple Ave Baltimore, MD 21215
Pimlico Good Neighbors NeighborhoodEstimated Value: $84,000 - $113,584
Studio
1
Bath
812
Sq Ft
$122/Sq Ft
Est. Value
About This Home
This home is located at 5312 Maple Ave, Baltimore, MD 21215 and is currently estimated at $98,792, approximately $121 per square foot. 5312 Maple Ave is a home located in Baltimore City with nearby schools including Arlington Elementary/Middle School, Booker T. Washington Middle School, and Forest Park High School.
Ownership History
Date
Name
Owned For
Owner Type
Purchase Details
Closed on
Dec 13, 2019
Sold by
Obazee Patrick
Bought by
Jnt Enterprise Llc
Current Estimated Value
Purchase Details
Closed on
Oct 5, 2006
Sold by
Bache Kevin
Bought by
Obazee Patrick
Purchase Details
Closed on
Aug 25, 2006
Sold by
Bache Kevin
Bought by
Obazee Patrick
Purchase Details
Closed on
Oct 9, 2001
Sold by
Bache Kevin
Bought by
Tomorrow'S Development Corp
Purchase Details
Closed on
Sep 28, 2001
Sold by
Tommorrow'S Development Corp
Bought by
Bache Kevin
Purchase Details
Closed on
May 8, 2001
Sold by
First National Bank Of Chicago
Bought by
Tommorrow'S Development Corp
Purchase Details
Closed on
Jun 3, 1999
Sold by
Owens Robert
Bought by
Ocwen Federal Bank Fsb
Purchase Details
Closed on
Apr 15, 1994
Sold by
Slade Realty #3 Corp
Bought by
Owens Robert
Create a Home Valuation Report for This Property
The Home Valuation Report is an in-depth analysis detailing your home's value as well as a comparison with similar homes in the area
Home Values in the Area
Average Home Value in this Area
Purchase History
| Date | Buyer | Sale Price | Title Company |
|---|---|---|---|
| Jnt Enterprise Llc | $8,000 | Clear Title Group | |
| Obazee Patrick | $56,000 | -- | |
| Obazee Patrick | $56,000 | -- | |
| Tomorrow'S Development Corp | -- | -- | |
| Bache Kevin | $53,000 | -- | |
| Tommorrow'S Development Corp | $11,500 | -- | |
| First National Bank Of Chicago | $29,500 | -- | |
| Ocwen Federal Bank Fsb | $29,500 | -- | |
| Owens Robert | $46,900 | -- |
Source: Public Records
Tax History
| Year | Tax Paid | Tax Assessment Tax Assessment Total Assessment is a certain percentage of the fair market value that is determined by local assessors to be the total taxable value of land and additions on the property. | Land | Improvement |
|---|---|---|---|---|
| 2025 | $705 | $56,667 | -- | -- |
| 2024 | $705 | $30,000 | $7,000 | $23,000 |
| 2023 | $705 | $30,000 | $7,000 | $23,000 |
| 2022 | $708 | $30,000 | $7,000 | $23,000 |
| 2021 | $944 | $40,000 | $9,000 | $31,000 |
| 2020 | $944 | $40,000 | $9,000 | $31,000 |
| 2019 | $940 | $40,000 | $9,000 | $31,000 |
| 2018 | $1,182 | $50,100 | $5,000 | $45,100 |
| 2017 | $1,182 | $50,100 | $0 | $0 |
| 2016 | $1,187 | $50,100 | $0 | $0 |
| 2015 | $1,187 | $50,100 | $0 | $0 |
| 2014 | $1,187 | $50,100 | $0 | $0 |
Source: Public Records
Map
Nearby Homes
- 5313 Hamlin Ave
- 5327 Hamlin Ave
- 3318 Avondale Ave
- 3408 Avondale Ave
- 5409 Park Heights Ave
- 3208 Ingleside Ave
- 5427 Park Heights Ave
- 3405 Paton Ave
- 3218 W Belvedere Ave
- 3304 W Belvedere Ave
- 3514 Hayward Ave
- 3316 W Belvedere Ave
- 3424 W Belvedere Ave
- 3035 W Belvedere Ave
- 5330 Beaufort Ave
- 5201 Beaufort Ave
- 5226 Beaufort Ave
- 3213 Spaulding Ave
- 3223 Spaulding Ave
- 3525 W Belvedere Ave
- 5310 Maple Ave
- 5314 Maple Ave
- 5308 Maple Ave
- 5316 Maple Ave
- 5306 Maple Ave
- 5318 Maple Ave
- 5304 Maple Ave
- 5320 Maple Ave
- 5302 Maple Ave
- 5322 Maple Ave
- 5300 Maple Ave
- 5324 Maple Ave
- 5326 Maple Ave
- 5305 Ethelbert Ave
- 5307 Ethelbert Ave
- 5328 Maple Ave
- 5303 Ethelbert Ave
- 5330 Maple Ave
- 5311 Maple Ave
- 5309 Maple Ave
Your Personal Tour Guide
Ask me questions while you tour the home.