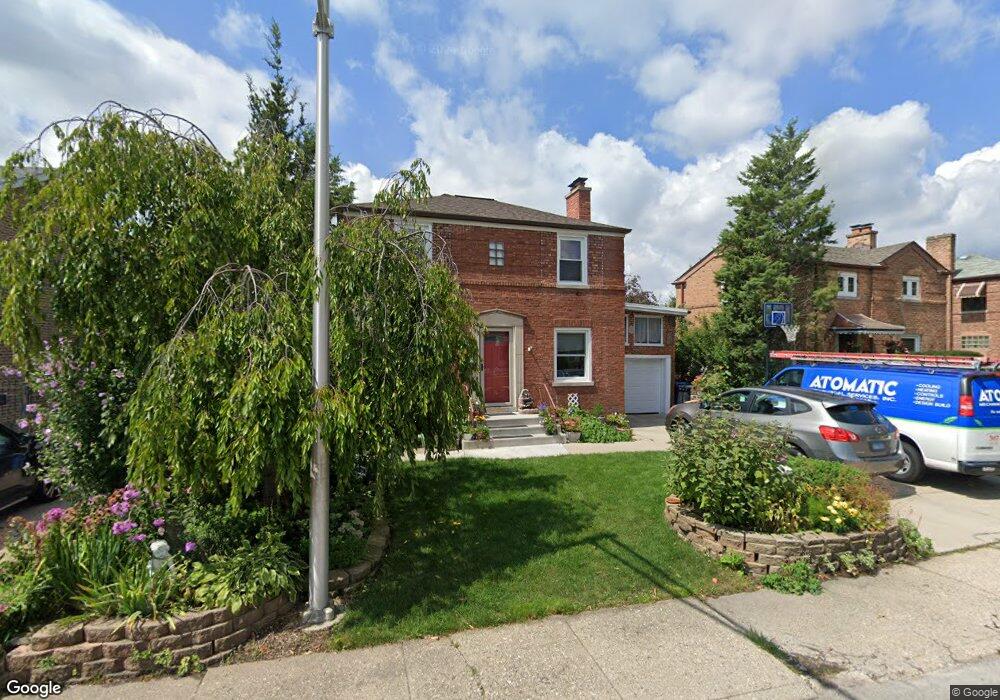
5312 N Oconto Ave Chicago, IL 60656
Norwood Park NeighborhoodEstimated Value: $475,705 - $550,000
3
Beds
2
Baths
1,811
Sq Ft
$286/Sq Ft
Est. Value
About This Home
This home is located at 5312 N Oconto Ave, Chicago, IL 60656 and is currently estimated at $517,176, approximately $285 per square foot. 5312 N Oconto Ave is a home located in Cook County with nearby schools including Oriole Park Elementary School, William Howard Taft High School, and St. Monica Academy.
Ownership History
Date
Name
Owned For
Owner Type
Purchase Details
Closed on
Jun 25, 2018
Sold by
Schenatzki Gina V
Bought by
Schenatzki Gina V and Gina V Schenatzki Revocable Trust
Current Estimated Value
Purchase Details
Closed on
Apr 9, 2002
Sold by
Constantine Zografopoulos Constantine and Constantine Zografopoules
Bought by
Schenatzki Matthew A and Schenatzki Gina V
Home Financials for this Owner
Home Financials are based on the most recent Mortgage that was taken out on this home.
Original Mortgage
$185,000
Outstanding Balance
$77,348
Interest Rate
6.93%
Estimated Equity
$439,828
Purchase Details
Closed on
Aug 6, 2001
Sold by
Ciesielski Pawel and Ciesielski Lucja
Bought by
Zografopoulos Constantine
Home Financials for this Owner
Home Financials are based on the most recent Mortgage that was taken out on this home.
Original Mortgage
$184,000
Interest Rate
7.15%
Create a Home Valuation Report for This Property
The Home Valuation Report is an in-depth analysis detailing your home's value as well as a comparison with similar homes in the area
Home Values in the Area
Average Home Value in this Area
Purchase History
| Date | Buyer | Sale Price | Title Company |
|---|---|---|---|
| Schenatzki Gina V | -- | Attorney | |
| Schenatzki Matthew A | $312,500 | Mercury Title Company | |
| Zografopoulos Constantine | $230,500 | -- |
Source: Public Records
Mortgage History
| Date | Status | Borrower | Loan Amount |
|---|---|---|---|
| Open | Schenatzki Matthew A | $185,000 | |
| Previous Owner | Zografopoulos Constantine | $184,000 |
Source: Public Records
Tax History Compared to Growth
Tax History
| Year | Tax Paid | Tax Assessment Tax Assessment Total Assessment is a certain percentage of the fair market value that is determined by local assessors to be the total taxable value of land and additions on the property. | Land | Improvement |
|---|---|---|---|---|
| 2024 | $7,529 | $44,001 | $12,178 | $31,823 |
| 2023 | $7,318 | $39,000 | $9,742 | $29,258 |
| 2022 | $7,318 | $39,000 | $9,742 | $29,258 |
| 2021 | $7,173 | $39,000 | $9,742 | $29,258 |
| 2020 | $6,198 | $30,923 | $6,088 | $24,835 |
| 2019 | $6,138 | $33,982 | $6,088 | $27,894 |
| 2018 | $6,034 | $33,982 | $6,088 | $27,894 |
| 2017 | $5,994 | $31,217 | $5,358 | $25,859 |
| 2016 | $5,752 | $31,217 | $5,358 | $25,859 |
| 2015 | $5,541 | $32,861 | $5,358 | $27,503 |
| 2014 | $3,492 | $21,389 | $4,871 | $16,518 |
| 2013 | $3,412 | $21,389 | $4,871 | $16,518 |
Source: Public Records
Map
Nearby Homes
- 7226 W Summerdale Ave
- 7127 W Summerdale Ave
- 5345 N Neva Ave
- 7229 W Higgins Ave Unit 602
- 5205 N Osceola Ave
- 5056 N Mont Clare Ave
- 5048 N Nottingham Ave
- 5001-5015 N Harlem Ave
- 6959 W Higgins Ave Unit 1S
- 4947 N Harlem Ave Unit 1
- 5526 N Nordica Ave
- 7350 W Argyle St
- 5107 N Sayre Ave
- 7501 W Winnemac Ave
- 5651 N Neva Ave
- 7635 W Foster Ave
- 5409 N New England Ave
- 7519 W Argyle St
- 7502 W Strong St
- 5818 N Octavia Ave
- 5306 N Oconto Ave
- 5316 N Oconto Ave
- 5322 N Oconto Ave
- 5300 N Oconto Ave
- 7310 W Summerdale Ave
- 7306 W Summerdale Ave
- 7314 W Summerdale Ave
- 5326 N Oconto Ave
- 7300 W Summerdale Ave
- 5309 N Oconto Ave
- 5309 N Oconto Ave Unit 1
- 5315 N Oconto Ave
- 5317 N Oconto Ave
- 5321 N Oconto Ave
- 5311 N Oconto Ave
- 7318 W Summerdale Ave
- 5330 N Oconto Ave
- 5305 N Oconto Ave
- 5303 N Oconto Ave
- 5323 N Oconto Ave