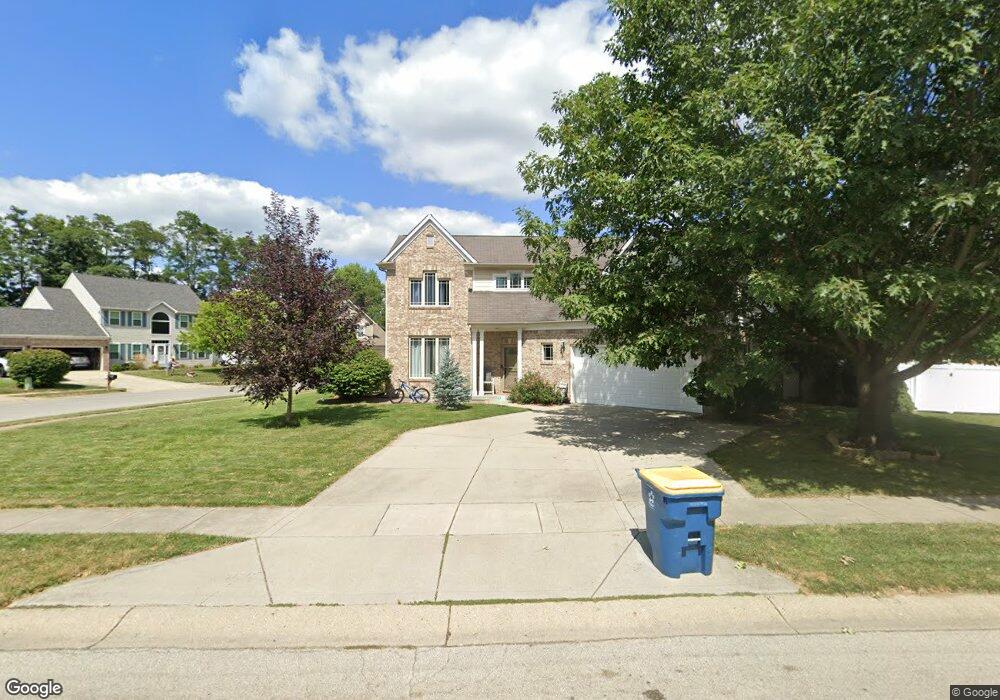
5312 Rippling Brook Way Carmel, IN 46033
East Carmel NeighborhoodEstimated Value: $456,007 - $472,000
4
Beds
3
Baths
2,624
Sq Ft
$177/Sq Ft
Est. Value
About This Home
This home is located at 5312 Rippling Brook Way, Carmel, IN 46033 and is currently estimated at $464,752, approximately $177 per square foot. 5312 Rippling Brook Way is a home located in Hamilton County with nearby schools including Cherry Tree Elementary School, Clay Middle School, and Carmel High School.
Ownership History
Date
Name
Owned For
Owner Type
Purchase Details
Closed on
Apr 13, 2018
Sold by
Morrow Scott A and Morrow Bethany L
Bought by
Zuben Oleksandr and Vovk Olga
Current Estimated Value
Home Financials for this Owner
Home Financials are based on the most recent Mortgage that was taken out on this home.
Original Mortgage
$228,000
Outstanding Balance
$195,185
Interest Rate
4.43%
Mortgage Type
New Conventional
Estimated Equity
$269,567
Purchase Details
Closed on
Feb 21, 2007
Sold by
Williams Raymond E and Williams Ruth Ann
Bought by
Morrow Scott A and Morrow Bethany L
Home Financials for this Owner
Home Financials are based on the most recent Mortgage that was taken out on this home.
Original Mortgage
$170,320
Interest Rate
6.27%
Mortgage Type
Purchase Money Mortgage
Purchase Details
Closed on
Dec 29, 2000
Sold by
Ivy Homes Inc
Bought by
Williams Raymond E and Williams Ruth Ann
Home Financials for this Owner
Home Financials are based on the most recent Mortgage that was taken out on this home.
Original Mortgage
$188,100
Interest Rate
7.77%
Create a Home Valuation Report for This Property
The Home Valuation Report is an in-depth analysis detailing your home's value as well as a comparison with similar homes in the area
Home Values in the Area
Average Home Value in this Area
Purchase History
| Date | Buyer | Sale Price | Title Company |
|---|---|---|---|
| Zuben Oleksandr | -- | Chicago Title Co Llc | |
| Morrow Scott A | -- | None Available | |
| Williams Raymond E | -- | -- |
Source: Public Records
Mortgage History
| Date | Status | Borrower | Loan Amount |
|---|---|---|---|
| Open | Zuben Oleksandr | $228,000 | |
| Previous Owner | Morrow Scott A | $170,320 | |
| Previous Owner | Williams Raymond E | $188,100 |
Source: Public Records
Tax History Compared to Growth
Tax History
| Year | Tax Paid | Tax Assessment Tax Assessment Total Assessment is a certain percentage of the fair market value that is determined by local assessors to be the total taxable value of land and additions on the property. | Land | Improvement |
|---|---|---|---|---|
| 2024 | $3,441 | $359,500 | $105,400 | $254,100 |
| 2023 | $3,441 | $332,500 | $98,000 | $234,500 |
| 2022 | $3,243 | $290,000 | $98,000 | $192,000 |
| 2021 | $2,757 | $252,800 | $98,000 | $154,800 |
| 2020 | $2,757 | $252,800 | $98,000 | $154,800 |
| 2019 | $2,535 | $237,900 | $47,400 | $190,500 |
| 2018 | $2,182 | $213,000 | $47,400 | $165,600 |
| 2017 | $2,111 | $203,600 | $47,400 | $156,200 |
| 2016 | $2,065 | $198,600 | $47,400 | $151,200 |
| 2014 | $1,821 | $192,800 | $40,700 | $152,100 |
| 2013 | $1,821 | $185,700 | $40,700 | $145,000 |
Source: Public Records
Map
Nearby Homes
- 5325 Creekbend Dr
- 14564 White Hall Cir
- 5522 White Hall Way
- 14304 Woodfield Dr S
- 5989 Ashmore Ln
- 5703 Polk Dr
- 5703 Polk Dr Unit 203
- 5712 Polk Dr
- 5676 Polk Dr
- 6144 Burleigh Place
- 14831 Drayton Dr
- 5310 Gray Eagle Ct
- 5474 Cayman Ct
- 14886 Redcliff Dr
- 5812 Bluestem Ct
- 5808 Corralberry Ct
- 15067 Carrick Rd
- 4929 Deer Ridge Dr S
- 13789 Stone Haven Dr
- 5175 Montview Way
- 5314 Ripplingbrook Way
- 5314 Rippling Brook Way
- 5315 Rippling Brook Way
- 5315 Ripplingbrook Way
- 5316 Rippling Brook Way
- 5313 Ripplingbrook Way
- 5323 Creekbend Dr
- 5316 Ripplingbrook Way
- 5313 Rippling Brook Way
- 5314 Creekbend Dr
- 5316 Creekbend Dr
- 5311 Rippling Brook Way
- 5312 Creekbend Dr
- 5317 Rippling Brook Way
- 5318 Creekbend Dr
- 5317 Ripplingbrook Way
- 5311 Ripplingbrook Way
- 5318 Ripplingbrook Way
- 5318 Rippling Brook Way
- 5320 Creekbend Dr