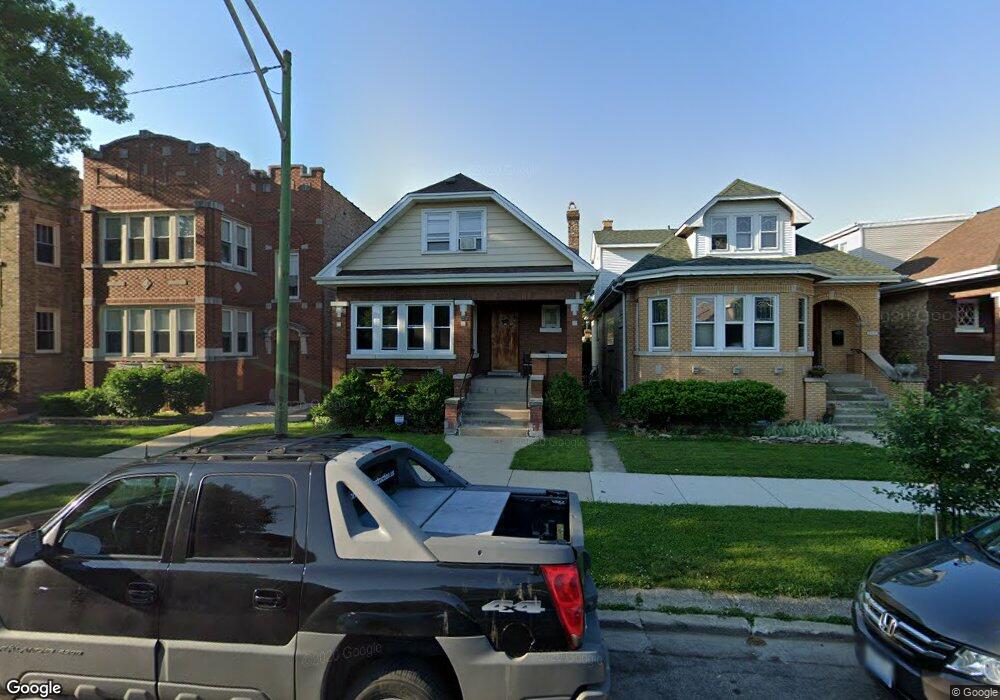
5313 W Byron St Chicago, IL 60641
Portage Park NeighborhoodEstimated Value: $353,000 - $523,000
3
Beds
1
Bath
1,542
Sq Ft
$280/Sq Ft
Est. Value
About This Home
This home is located at 5313 W Byron St, Chicago, IL 60641 and is currently estimated at $431,368, approximately $279 per square foot. 5313 W Byron St is a home located in Cook County with nearby schools including William P Gray Elementary School, Schurz High School, and St. Bartholomew School.
Ownership History
Date
Name
Owned For
Owner Type
Purchase Details
Closed on
Mar 27, 2015
Sold by
Camuy Pedro
Bought by
Camuy Pedro and Camuy Celines
Current Estimated Value
Home Financials for this Owner
Home Financials are based on the most recent Mortgage that was taken out on this home.
Original Mortgage
$200,000
Outstanding Balance
$156,408
Interest Rate
4.5%
Mortgage Type
New Conventional
Estimated Equity
$274,960
Purchase Details
Closed on
Sep 15, 2007
Sold by
Pabon Henry and Camuy Pedro
Bought by
Camuy Pedro
Purchase Details
Closed on
Jun 10, 2002
Sold by
Guaranty Trust Company
Bought by
Pabon Henry and Camuy Pedro
Home Financials for this Owner
Home Financials are based on the most recent Mortgage that was taken out on this home.
Original Mortgage
$152,000
Interest Rate
6.93%
Purchase Details
Closed on
Oct 12, 2001
Sold by
Hoskinson Christine Borg
Bought by
Guaranty Trust Company and Trust #L001-048
Create a Home Valuation Report for This Property
The Home Valuation Report is an in-depth analysis detailing your home's value as well as a comparison with similar homes in the area
Home Values in the Area
Average Home Value in this Area
Purchase History
We collect this data history from publicly available records. To have your information removed, we recommend requesting removal directly through your county’s website.
| Date | Buyer | Sale Price | Title Company |
|---|---|---|---|
| Camuy Pedro | -- | Snp Title Co | |
| Camuy Pedro | -- | None Available | |
| Pabon Henry | $190,000 | -- | |
| Guaranty Trust Company | -- | -- |
Source: Public Records
Mortgage History
We collect this data history from publicly available records. To have your information removed, we recommend requesting removal directly through your county’s website.
| Date | Status | Borrower | Loan Amount |
|---|---|---|---|
| Open | Camuy Pedro | $200,000 | |
| Closed | Pabon Henry | $152,000 |
Source: Public Records
Tax History
| Year | Tax Paid | Tax Assessment Tax Assessment Total Assessment is a certain percentage of the fair market value that is determined by local assessors to be the total taxable value of land and additions on the property. | Land | Improvement |
|---|---|---|---|---|
| 2025 | $6,267 | $37,000 | $12,705 | $24,295 |
| 2024 | $6,267 | $37,000 | $12,705 | $24,295 |
| 2023 | $6,087 | $33,000 | $10,164 | $22,836 |
| 2022 | $6,087 | $33,000 | $10,164 | $22,836 |
| 2021 | $5,970 | $33,000 | $10,164 | $22,836 |
| 2020 | $5,887 | $29,512 | $4,537 | $24,975 |
| 2019 | $5,977 | $33,160 | $4,537 | $28,623 |
| 2018 | $5,875 | $33,160 | $4,537 | $28,623 |
| 2017 | $5,235 | $24,303 | $3,993 | $20,310 |
| 2016 | $4,870 | $24,303 | $3,993 | $20,310 |
| 2015 | $4,456 | $24,303 | $3,993 | $20,310 |
| 2014 | $4,373 | $23,554 | $3,630 | $19,924 |
| 2013 | $4,287 | $23,554 | $3,630 | $19,924 |
Source: Public Records
Map
Nearby Homes
- 5339 W Berenice Ave
- 5411 W Byron St
- 5212 W Berenice Ave
- 5411 W Warwick Ave
- 5236 W Cuyler Ave
- 5452 W Warwick Ave
- 3614 N Lotus Ave
- 5138 W Addison St
- 5226 W Eddy St
- 4954 W Byron St
- 3823 N Lavergne Ave
- 5120 W Eddy St
- 4036 N Parkside Ave
- 5428 W Cornelia Ave
- 4039 N Major Ave
- 5719 W Dakin St
- 4904 W Byron St
- 4108 N Parkside Ave
- 5641 W Patterson Ave
- 4154 N Dickinson Ave
- 5317 W Byron St
- 5311 W Byron St
- 5311 W Byron St Unit 2
- 5307 W Byron St
- 5319 W Byron St
- 5323 W Byron St
- 5305 W Byron St
- 5305 W Byron St
- 5325 W Byron St
- 3850 N Lockwood Ave
- 3852 N Lockwood Ave
- 5310 W Berenice Ave
- 5310 W Berenice Ave
- 5329 W Byron St
- 5316 W Berenice Ave
- 5312 W Berenice Ave Unit 1
- 5320 W Berenice Ave
- 5306 W Berenice Ave
- 5306 W Berenice Ave
- 5318 W Berenice Ave
Your Personal Tour Guide
Ask me questions while you tour the home.