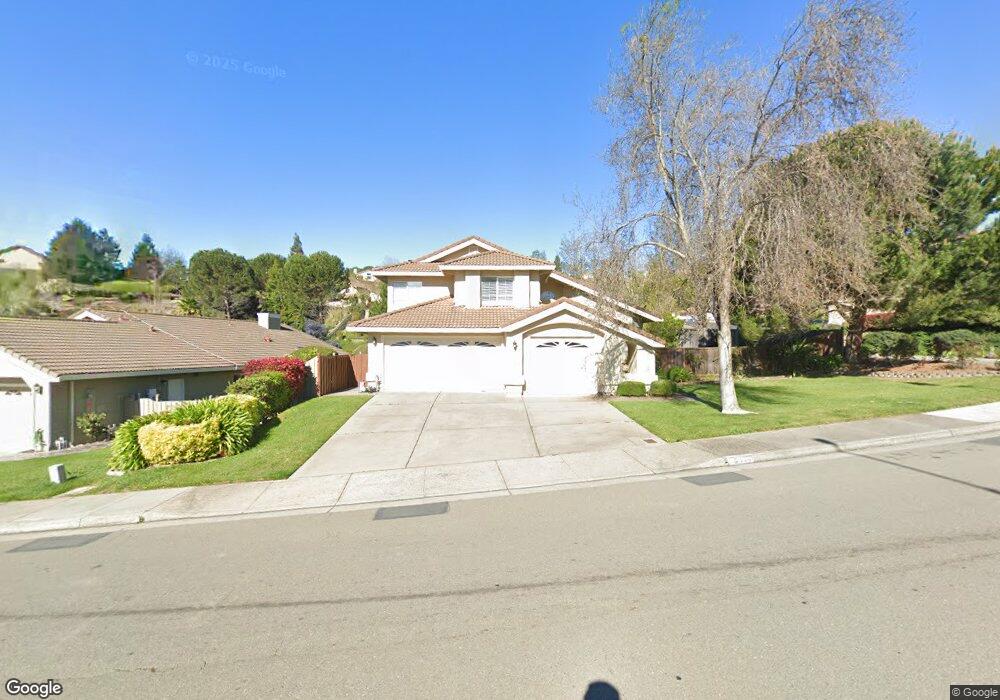
5314 Conestoga Way El Sobrante, CA 94803
Carriage Hills NeighborhoodEstimated Value: $996,000 - $1,038,342
4
Beds
3
Baths
2,483
Sq Ft
$410/Sq Ft
Est. Value
About This Home
This home is located at 5314 Conestoga Way, El Sobrante, CA 94803 and is currently estimated at $1,019,086, approximately $410 per square foot. 5314 Conestoga Way is a home located in Contra Costa County with nearby schools including Olinda Elementary School, Betty Reid Soskin Middle School, and De Anza Senior High School.
Ownership History
Date
Name
Owned For
Owner Type
Purchase Details
Closed on
Sep 9, 2024
Sold by
Maynard Aminta
Bought by
Hill Andre R
Current Estimated Value
Purchase Details
Closed on
Aug 18, 2021
Sold by
Hill Andre R and Maynard Aminta
Bought by
Hill Andre R and Maynard Aminta
Home Financials for this Owner
Home Financials are based on the most recent Mortgage that was taken out on this home.
Original Mortgage
$423,000
Interest Rate
2.8%
Mortgage Type
New Conventional
Purchase Details
Closed on
Oct 8, 2002
Sold by
Cabellon Barbara L
Bought by
Hill Andre and Thornton Aminta
Home Financials for this Owner
Home Financials are based on the most recent Mortgage that was taken out on this home.
Original Mortgage
$372,000
Interest Rate
6.17%
Mortgage Type
Stand Alone First
Purchase Details
Closed on
Jul 20, 2000
Sold by
Cabellon Jesus B and Cabellon Jesus
Bought by
Cabellon Barbara L
Create a Home Valuation Report for This Property
The Home Valuation Report is an in-depth analysis detailing your home's value as well as a comparison with similar homes in the area
Home Values in the Area
Average Home Value in this Area
Purchase History
| Date | Buyer | Sale Price | Title Company |
|---|---|---|---|
| Hill Andre R | -- | None Listed On Document | |
| Hill Andre R | -- | Chicago Title Company | |
| Hill Andre | $467,000 | First American Title | |
| Cabellon Barbara L | -- | -- |
Source: Public Records
Mortgage History
| Date | Status | Borrower | Loan Amount |
|---|---|---|---|
| Previous Owner | Hill Andre R | $423,000 | |
| Previous Owner | Hill Andre | $372,000 | |
| Closed | Hill Andre | $46,500 |
Source: Public Records
Tax History Compared to Growth
Tax History
| Year | Tax Paid | Tax Assessment Tax Assessment Total Assessment is a certain percentage of the fair market value that is determined by local assessors to be the total taxable value of land and additions on the property. | Land | Improvement |
|---|---|---|---|---|
| 2025 | $10,675 | $785,675 | $322,914 | $462,761 |
| 2024 | $10,455 | $663,088 | $265,517 | $397,571 |
| 2023 | $10,455 | $650,087 | $260,311 | $389,776 |
| 2022 | $10,213 | $637,341 | $255,207 | $382,134 |
| 2021 | $10,165 | $624,845 | $250,203 | $374,642 |
| 2019 | $9,611 | $606,314 | $242,783 | $363,531 |
| 2018 | $9,268 | $594,426 | $238,023 | $356,403 |
| 2017 | $9,062 | $582,771 | $233,356 | $349,415 |
| 2016 | $8,963 | $571,345 | $228,781 | $342,564 |
| 2015 | $8,939 | $562,764 | $225,345 | $337,419 |
| 2014 | $8,116 | $502,500 | $201,214 | $301,286 |
Source: Public Records
Map
Nearby Homes
- 5378 Conestoga Way
- 5567 Woodview Dr
- 5472 Country View Dr
- 2305 Marlin Ct
- 3950 Pinole Valley Rd
- 705 Devils Drop Ct
- 5909 Amend Rd
- 2323 Doidge Ave
- 2358 Wright Ave
- 3656 Morningside Dr
- 7 Abbie Ln
- 2543 Heide Ct
- 2537 Heide Ct
- 2632 Wright Ave
- 5774 Friar Ct
- 628 Stanley Ln
- 109 Scotts Chute Ct
- 0 Knobcone Unit 41077144
- 2558 Silvercrest Ct
- 615 Stanley Ln
- 5326 Conestoga Way
- 5257 Cutter Ln
- 5104 Carriage Dr
- 5338 Conestoga Way
- 5319 Conestoga Way
- 5085 Carriage Dr
- 5103 Carriage Dr
- 5325 Conestoga Way
- 5350 Conestoga Way
- 5341 Conestoga Way
- 5110 Carriage Dr
- 5109 Carriage Dr
- 5245 Cutter Ln
- 5073 Carriage Dr
- 5237 Cutter Ln
- 5118 Carriage Dr
- 5115 Carriage Dr
- 5362 Conestoga Way
- 5229 Cutter Ln
- 4701 Surrey Ln