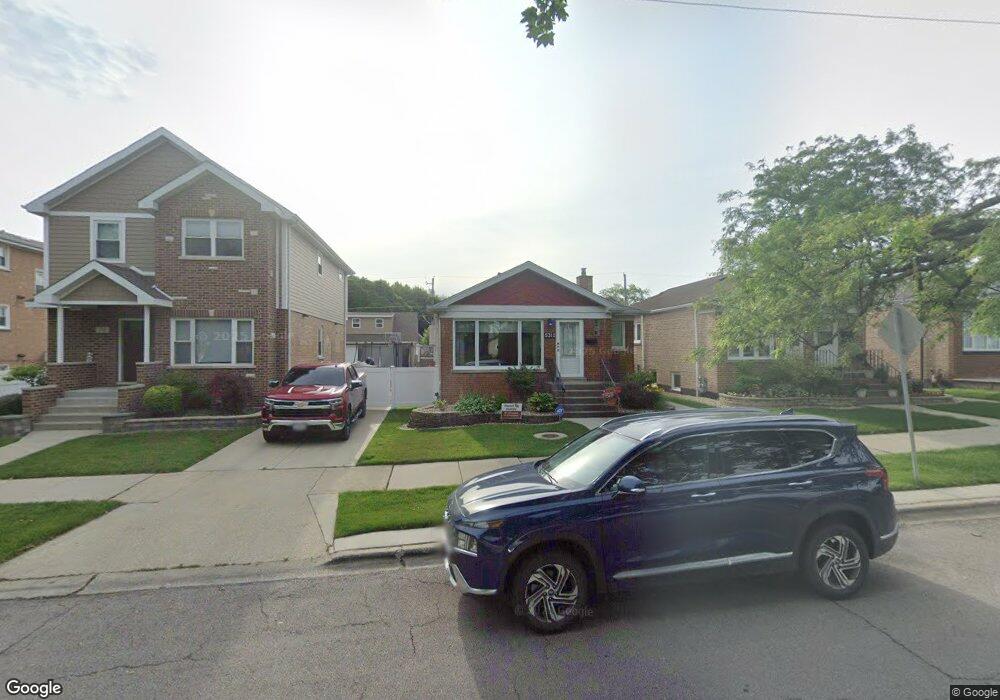
5315 S Narragansett Ave Chicago, IL 60638
Garfield Ridge NeighborhoodEstimated Value: $294,000 - $389,000
2
Beds
1
Bath
1,083
Sq Ft
$309/Sq Ft
Est. Value
About This Home
This home is located at 5315 S Narragansett Ave, Chicago, IL 60638 and is currently estimated at $334,897, approximately $309 per square foot. 5315 S Narragansett Ave is a home located in Cook County with nearby schools including Byrne Elementary School, Kennedy High School, and St Daniel The Prophet School.
Ownership History
Date
Name
Owned For
Owner Type
Purchase Details
Closed on
Jan 22, 2009
Sold by
Butney Joseph Jo M
Bought by
Butney Joseph Jo M and Butney Julie M
Current Estimated Value
Home Financials for this Owner
Home Financials are based on the most recent Mortgage that was taken out on this home.
Original Mortgage
$230,000
Outstanding Balance
$144,835
Interest Rate
5.11%
Mortgage Type
New Conventional
Estimated Equity
$190,062
Purchase Details
Closed on
Oct 4, 2002
Sold by
Keammerlen John J and Keammerlen Lynda A
Bought by
Butney Joseph M
Home Financials for this Owner
Home Financials are based on the most recent Mortgage that was taken out on this home.
Original Mortgage
$204,440
Interest Rate
6.29%
Purchase Details
Closed on
May 31, 1996
Sold by
Bank Of Lyons
Bought by
Keammerlen John J and Keammerlen Lydia A
Home Financials for this Owner
Home Financials are based on the most recent Mortgage that was taken out on this home.
Original Mortgage
$123,000
Interest Rate
8.29%
Create a Home Valuation Report for This Property
The Home Valuation Report is an in-depth analysis detailing your home's value as well as a comparison with similar homes in the area
Home Values in the Area
Average Home Value in this Area
Purchase History
| Date | Buyer | Sale Price | Title Company |
|---|---|---|---|
| Butney Joseph Jo M | -- | None Available | |
| Butney Joseph M | $215,500 | -- | |
| Keammerlen John J | $158,000 | Intercounty Title |
Source: Public Records
Mortgage History
| Date | Status | Borrower | Loan Amount |
|---|---|---|---|
| Open | Butney Joseph Jo M | $230,000 | |
| Closed | Butney Joseph M | $204,440 | |
| Previous Owner | Keammerlen John J | $123,000 |
Source: Public Records
Tax History Compared to Growth
Tax History
| Year | Tax Paid | Tax Assessment Tax Assessment Total Assessment is a certain percentage of the fair market value that is determined by local assessors to be the total taxable value of land and additions on the property. | Land | Improvement |
|---|---|---|---|---|
| 2024 | $3,949 | $26,861 | $5,775 | $21,086 |
| 2023 | $3,829 | $22,706 | $5,156 | $17,550 |
| 2022 | $3,829 | $22,706 | $5,156 | $17,550 |
| 2021 | $3,741 | $21,932 | $5,156 | $16,776 |
| 2020 | $3,323 | $17,923 | $4,125 | $13,798 |
| 2019 | $3,333 | $19,915 | $4,125 | $15,790 |
| 2018 | $3,276 | $19,915 | $4,125 | $15,790 |
| 2017 | $2,422 | $14,553 | $3,712 | $10,841 |
| 2016 | $2,431 | $14,553 | $3,712 | $10,841 |
| 2015 | $2,543 | $16,398 | $3,712 | $12,686 |
| 2014 | $2,099 | $13,795 | $3,506 | $10,289 |
| 2013 | $2,047 | $13,795 | $3,506 | $10,289 |
Source: Public Records
Map
Nearby Homes
- 5248 S Narragansett Ave
- 5250 S Nagle Ave
- 5142 S Mulligan Ave
- 5253 S Mobile Ave
- 5118 S Mobile Ave
- 6340 S Archer Ave
- 5141 S Merrimac Ave
- 5112 S Nashville Ave
- 5417 S Melvina Ave Unit 102
- 5519 S Nashville Ave
- 5128 S Meade Ave
- 5137 S Rutherford Ave
- 5536 S Normandy Ave
- 5637 S Natoma Ave
- 5427 S Newcastle Ave
- 5621 S Moody Ave
- 5653 S Normandy Ave
- 5245 S Mayfield Ave
- 5622 S Oak Park Ave
- 5148 S Newland Ave
- 5317 S Narragansett Ave
- 5309 S Narragansett Ave
- 5309 S Narragansett Ave
- 5321 S Narragansett Ave
- 5301 S Narragansett Ave
- 5323 S Narragansett Ave
- 5323 S Narragansett Ave
- 5312 S Mulligan Ave
- 5308 S Mulligan Ave
- 5316 S Mulligan Ave
- 5329 S Narragansett Ave
- 5304 S Mulligan Ave
- 5320 S Mulligan Ave
- 5322 S Mulligan Ave
- 5300 S Mulligan Ave
- 5308 S Narragansett Ave
- 5333 S Narragansett Ave Unit 2
- 5312 S Narragansett Ave
- 5312 S Narragansett Ave
- 5314 S Narragansett Ave