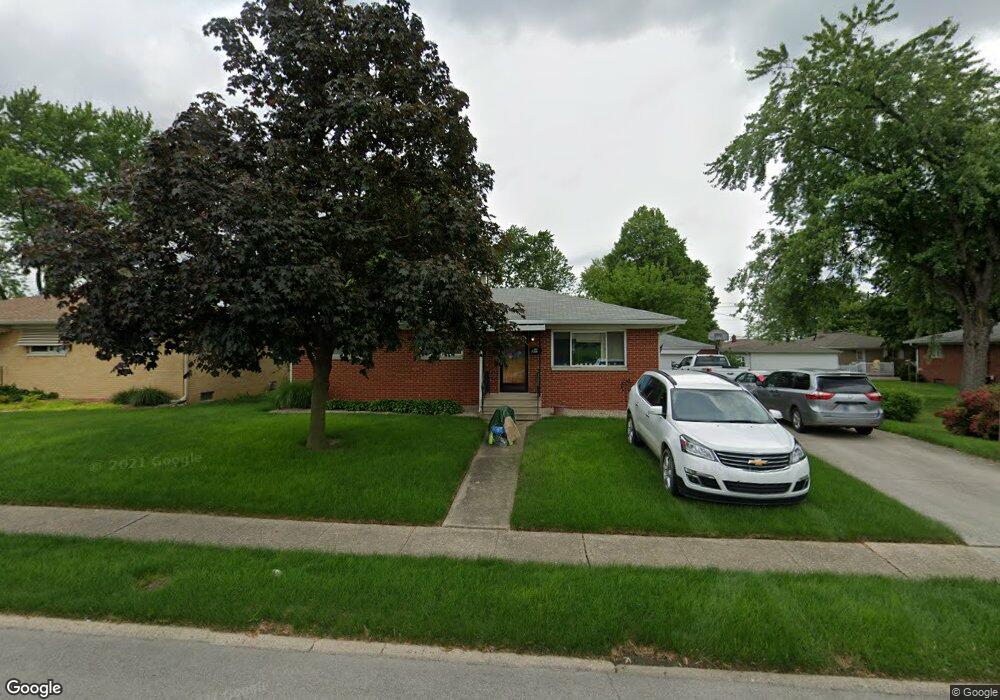
5316 W 25th St Indianapolis, IN 46224
Estimated Value: $262,000 - $295,000
3
Beds
2
Baths
2,466
Sq Ft
$113/Sq Ft
Est. Value
About This Home
This home is located at 5316 W 25th St, Indianapolis, IN 46224 and is currently estimated at $279,170, approximately $113 per square foot. 5316 W 25th St is a home located in Marion County with nearby schools including Speedway Junior High School, Speedway Senior High School, and St. Christopher School.
Ownership History
Date
Name
Owned For
Owner Type
Purchase Details
Closed on
Mar 18, 2011
Sold by
Tate Jennifer Rene
Bought by
Eversole Jennifer Renee
Current Estimated Value
Home Financials for this Owner
Home Financials are based on the most recent Mortgage that was taken out on this home.
Original Mortgage
$103,373
Outstanding Balance
$39,272
Interest Rate
4.99%
Mortgage Type
FHA
Estimated Equity
$239,898
Purchase Details
Closed on
Mar 23, 2009
Sold by
Classic Touch Realty Services Inc
Bought by
Tate Jennifer Rene
Purchase Details
Closed on
Feb 2, 2009
Sold by
Wells Fargo Bank Na
Bought by
Classic Touch Realty Services Inc
Purchase Details
Closed on
Dec 10, 2008
Sold by
Wells Fargo Bank Na
Bought by
Wells Fargo Bank Na
Purchase Details
Closed on
Aug 25, 2008
Sold by
Everton Annetta C
Bought by
Wells Fargo Bank Na
Create a Home Valuation Report for This Property
The Home Valuation Report is an in-depth analysis detailing your home's value as well as a comparison with similar homes in the area
Home Values in the Area
Average Home Value in this Area
Purchase History
| Date | Buyer | Sale Price | Title Company |
|---|---|---|---|
| Eversole Jennifer Renee | -- | None Available | |
| Tate Jennifer Rene | -- | None Available | |
| Classic Touch Realty Services Inc | -- | None Available | |
| Wells Fargo Bank Na | -- | None Available | |
| Wells Fargo Bank Na | $99,357 | None Available |
Source: Public Records
Mortgage History
| Date | Status | Borrower | Loan Amount |
|---|---|---|---|
| Open | Eversole Jennifer Renee | $103,373 |
Source: Public Records
Tax History Compared to Growth
Tax History
| Year | Tax Paid | Tax Assessment Tax Assessment Total Assessment is a certain percentage of the fair market value that is determined by local assessors to be the total taxable value of land and additions on the property. | Land | Improvement |
|---|---|---|---|---|
| 2024 | $3,174 | $260,800 | $22,100 | $238,700 |
| 2023 | $3,174 | $253,200 | $22,100 | $231,100 |
| 2022 | $2,984 | $234,600 | $22,100 | $212,500 |
| 2021 | $2,267 | $181,200 | $22,100 | $159,100 |
| 2020 | $1,952 | $159,200 | $22,100 | $137,100 |
| 2019 | $1,954 | $159,200 | $22,100 | $137,100 |
| 2018 | $1,819 | $148,200 | $22,100 | $126,100 |
| 2017 | $1,431 | $128,100 | $22,100 | $106,000 |
| 2016 | $1,411 | $125,400 | $22,100 | $103,300 |
| 2014 | $1,374 | $123,800 | $22,100 | $101,700 |
| 2013 | $1,368 | $120,200 | $22,100 | $98,100 |
Source: Public Records
Map
Nearby Homes
- 2432 Allison Ave
- 5555 Maplewood Dr
- 5609 Meadowood Dr
- 4953 Mccray St
- 5657 Maplewood Dr
- 2203 Cord St
- 4908 Baxter Dr
- 4915 Baxter Dr
- 6351 Crawfordsville Rd
- 2010 Winton Ave
- 1927 Gerrard Ave
- 5416 Speedway Dr
- 2005 Fisher Ave
- 3152 Allison Ave
- 5220 Crawfordsville Rd
- 3119 N Fuller Dr
- 1921 Patton Dr
- 1811 Christopher Ln
- 6143 Schoolwood Dr
- 1701 N Lynhurst Dr
- 5322 W 25th St
- 2506 N Lynhurst Dr
- 2518 N Lynhurst Dr
- 5330 W 25th St
- 5331 Maplewood Dr
- 5339 Maplewood Dr
- 2530 N Lynhurst Dr
- 5325 Maplewood Dr
- 5338 W 25th St
- 5345 Maplewood Dr
- 5305 Meadowood Dr
- 5315 Meadowood Dr
- 5353 Maplewood Dr
- 5344 W 25th St
- 5326 Maplewood Dr
- 5229 W 25th St
- 5329 Meadowood Dr
- 5361 Maplewood Dr
- 5334 Maplewood Dr
- 5354 W 25th St