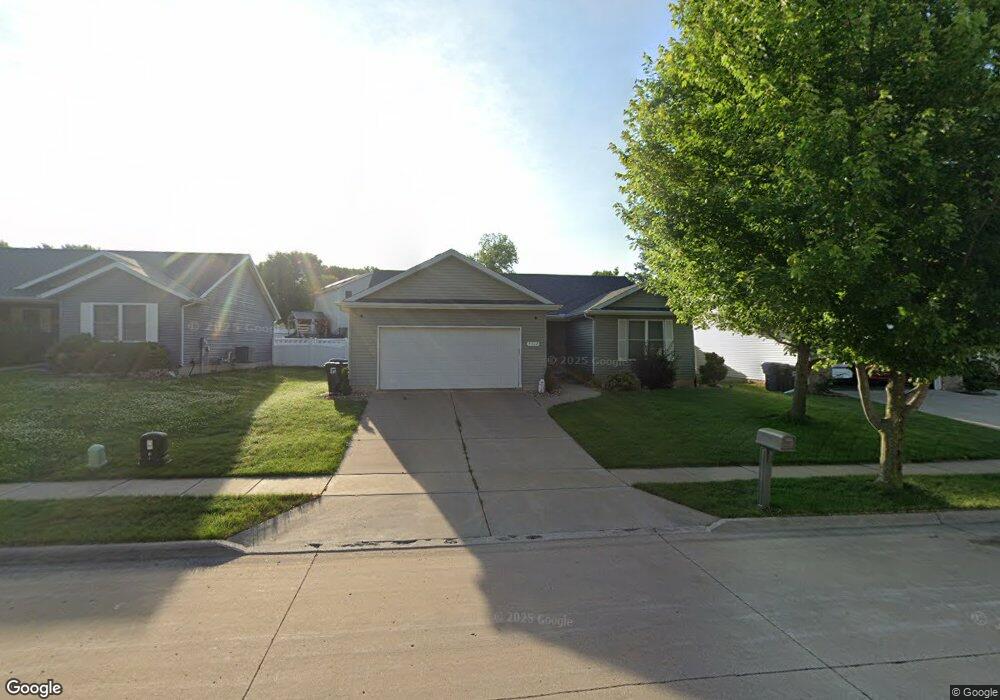
5317 Hillandale Rd Davenport, IA 52806
North Side NeighborhoodEstimated Value: $284,000 - $312,000
3
Beds
2
Baths
1,460
Sq Ft
$205/Sq Ft
Est. Value
About This Home
This home is located at 5317 Hillandale Rd, Davenport, IA 52806 and is currently estimated at $298,939, approximately $204 per square foot. 5317 Hillandale Rd is a home located in Scott County with nearby schools including Truman Elementary School, Wood Intermediate School, and North High School.
Ownership History
Date
Name
Owned For
Owner Type
Purchase Details
Closed on
Mar 8, 2022
Sold by
Perryman Corey J
Bought by
Corey J Perryman Revocable Trust
Current Estimated Value
Purchase Details
Closed on
Aug 4, 2020
Sold by
Griffin Demond N and Griffin Lisa L
Bought by
Perryman Corey J
Home Financials for this Owner
Home Financials are based on the most recent Mortgage that was taken out on this home.
Original Mortgage
$205,200
Interest Rate
2.9%
Mortgage Type
New Conventional
Purchase Details
Closed on
Oct 23, 2006
Sold by
Oakbrook Commons L C
Bought by
Griffin Demond N and Griffin Lisa L
Home Financials for this Owner
Home Financials are based on the most recent Mortgage that was taken out on this home.
Original Mortgage
$149,944
Interest Rate
5.87%
Mortgage Type
Adjustable Rate Mortgage/ARM
Purchase Details
Closed on
Jan 18, 2006
Sold by
Thunderbird Investment Corp
Bought by
Oakbrook Commons L C
Create a Home Valuation Report for This Property
The Home Valuation Report is an in-depth analysis detailing your home's value as well as a comparison with similar homes in the area
Home Values in the Area
Average Home Value in this Area
Purchase History
| Date | Buyer | Sale Price | Title Company |
|---|---|---|---|
| Corey J Perryman Revocable Trust | -- | None Listed On Document | |
| Perryman Corey J | $216,000 | None Available | |
| Griffin Demond N | $187,500 | None Available | |
| Oakbrook Commons L C | $491,000 | None Available |
Source: Public Records
Mortgage History
| Date | Status | Borrower | Loan Amount |
|---|---|---|---|
| Previous Owner | Perryman Corey J | $205,200 | |
| Previous Owner | Griffin Demond N | $149,944 |
Source: Public Records
Tax History Compared to Growth
Tax History
| Year | Tax Paid | Tax Assessment Tax Assessment Total Assessment is a certain percentage of the fair market value that is determined by local assessors to be the total taxable value of land and additions on the property. | Land | Improvement |
|---|---|---|---|---|
| 2025 | $4,314 | $264,150 | $38,720 | $225,430 |
| 2024 | $4,206 | $251,630 | $38,720 | $212,910 |
| 2023 | $4,400 | $251,630 | $38,720 | $212,910 |
| 2022 | $4,418 | $214,870 | $33,380 | $181,490 |
| 2021 | $4,418 | $214,870 | $33,380 | $181,490 |
| 2020 | $4,046 | $195,070 | $33,380 | $161,690 |
| 2019 | $4,074 | $190,120 | $33,380 | $156,740 |
| 2018 | $3,974 | $190,120 | $33,380 | $156,740 |
| 2017 | $1,055 | $189,680 | $33,380 | $156,300 |
| 2016 | $3,772 | $180,950 | $0 | $0 |
| 2015 | $3,772 | $178,430 | $0 | $0 |
| 2014 | $3,770 | $186,070 | $0 | $0 |
| 2013 | $3,866 | $0 | $0 | $0 |
| 2012 | -- | $160,590 | $22,830 | $137,760 |
Source: Public Records
Map
Nearby Homes
- 5312 Hillandale Rd
- 5300 Hillandale Rd
- 5335 Hillandale Rd
- 2620 W 54th St
- 5406 Hillandale Rd
- 5556 N Thornwood Ave
- 5026 N Dittmer St
- 5109 N Pine St
- 2725 W 49th St
- 5824 Hillandale Rd
- 2434 W 59th St
- 2127 W 51st St
- 4849 Oakwood Ct
- 1927 W 55th St
- 2203 W 59th St
- 3313 W 48th Place
- 3208 W 47th Place
- 3101 Fieldcrest Dr
- 1827 Welshire Dr
- 2426 W 44th St
- 5313 Hillandale Rd
- 5313 Hillandale Rd
- 5323 Hillandale Rd
- 2625 Revo Rd
- 5309 Hillandale Rd
- 2609 Revo Rd
- 5305 Hillandale Rd
- 5316 Hillandale Rd
- 5320 Hillandale Rd
- 2638 Revo Rd
- 5308 Hillandale Rd
- 5324 Hillandale Rd
- 2605 Revo Rd
- 5301 Hillandale Rd
- 2632 Revo Rd
- 2628 Revo Rd
- 2634 Revo Rd
- 2624 Revo Rd
- 5328 Hillandale Rd
- 2616 Revo Rd