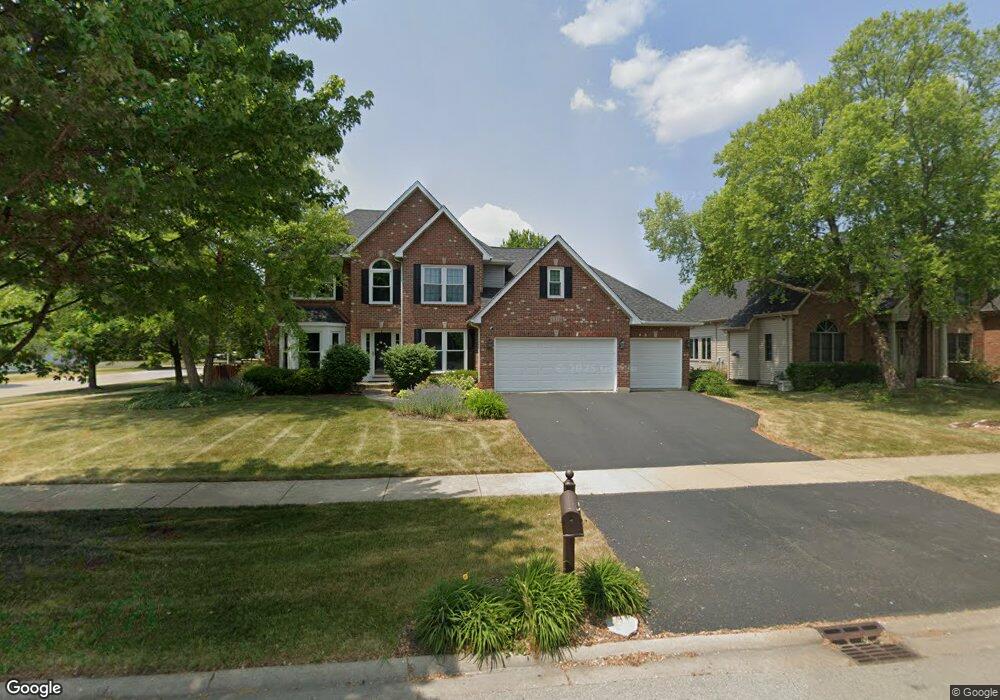
5319 Prairie Sage Rd Unit 53 Naperville, IL 60564
High Meadow NeighborhoodEstimated Value: $708,000 - $772,000
--
Bed
1
Bath
2,616
Sq Ft
$280/Sq Ft
Est. Value
About This Home
This home is located at 5319 Prairie Sage Rd Unit 53, Naperville, IL 60564 and is currently estimated at $731,417, approximately $279 per square foot. 5319 Prairie Sage Rd Unit 53 is a home located in Will County with nearby schools including Graham Elementary School, Clifford Crone Middle School, and Neuqua Valley High School.
Ownership History
Date
Name
Owned For
Owner Type
Purchase Details
Closed on
Jun 1, 2021
Sold by
Kocimski Steven J and Kocimski Kathleen
Bought by
Ahmed Zeeshan and Ahmed Nazyah
Current Estimated Value
Home Financials for this Owner
Home Financials are based on the most recent Mortgage that was taken out on this home.
Original Mortgage
$489,250
Outstanding Balance
$442,955
Interest Rate
2.9%
Mortgage Type
New Conventional
Estimated Equity
$288,462
Create a Home Valuation Report for This Property
The Home Valuation Report is an in-depth analysis detailing your home's value as well as a comparison with similar homes in the area
Home Values in the Area
Average Home Value in this Area
Purchase History
| Date | Buyer | Sale Price | Title Company |
|---|---|---|---|
| Ahmed Zeeshan | $515,000 | First American Title |
Source: Public Records
Mortgage History
| Date | Status | Borrower | Loan Amount |
|---|---|---|---|
| Open | Ahmed Zeeshan | $489,250 |
Source: Public Records
Tax History Compared to Growth
Tax History
| Year | Tax Paid | Tax Assessment Tax Assessment Total Assessment is a certain percentage of the fair market value that is determined by local assessors to be the total taxable value of land and additions on the property. | Land | Improvement |
|---|---|---|---|---|
| 2024 | $12,032 | $191,695 | $52,673 | $139,022 |
| 2023 | $12,032 | $169,342 | $46,531 | $122,811 |
| 2022 | $11,173 | $160,216 | $44,017 | $116,199 |
| 2021 | $11,173 | $152,587 | $41,921 | $110,666 |
| 2020 | $10,474 | $150,170 | $41,257 | $108,913 |
| 2019 | $10,294 | $145,938 | $40,094 | $105,844 |
| 2018 | $10,274 | $143,155 | $39,212 | $103,943 |
| 2017 | $10,116 | $139,460 | $38,200 | $101,260 |
| 2016 | $10,097 | $136,458 | $37,378 | $99,080 |
| 2015 | $10,139 | $131,209 | $35,940 | $95,269 |
| 2014 | $10,139 | $129,259 | $35,940 | $93,319 |
| 2013 | $10,139 | $129,259 | $35,940 | $93,319 |
Source: Public Records
Map
Nearby Homes
- 26106 W Sherwood Cir
- 23234 W Allagash Dr
- 24024 W Champion Dr
- 2547 Mallet Ct
- 2543 Mallet Ct
- 2539 Mallet Ct
- 2611 Lawlor Ln
- 2607 Lawlor Ln
- 2519 Mallet Ct
- 2515 Mallet Ct
- 2419 Lawlor Ln
- 2423 Lawlor Ln
- 2427 Lawlor Ln
- 2668 Lawlor Ln
- 2547 Tailshot Rd
- 5907 Polo St
- 5919 Polo St
- 5943 Polo St
- 2711 Lawlor Ln
- 2711 Wait Rd
- 5319 Prairie Sage Ln
- 5315 Prairie Sage Ln
- 5315 Prairie Sage Rd
- 2780 Pennyroyal Cir Unit 12
- 5327 Prairie Sage Rd Unit 12
- 5311 Prairie Sage Ln
- 5311 Prairie Sage Rd
- 5327 Prairie Sage Ln
- 5320 Prairie Sage Ln
- 5320 Prairie Sage Rd
- 5324 Prairie Sage Rd
- 5316 Prairie Sage Ln
- 5324 Prairie Sage Ln
- 2779 Pennyroyal Cir
- 2760 Pennyroyal Cir
- 5316 Prairie Sage Rd
- 2756 Pennyroyal Cir
- 5328 Prairie Sage Rd
- 5331 Prairie Sage Rd
- 2775 Pennyroyal Cir