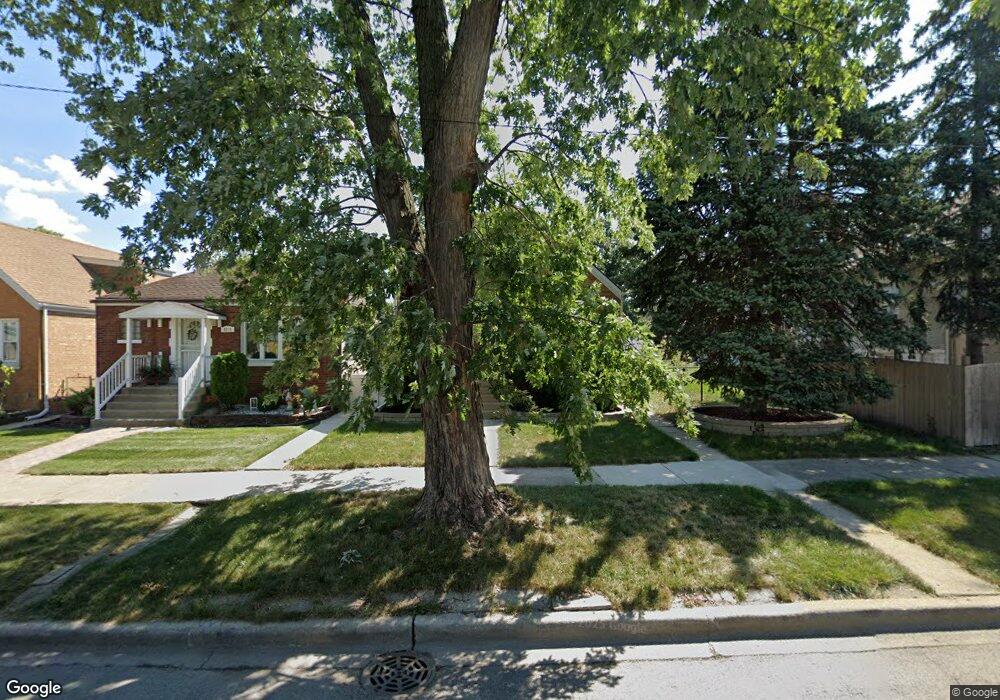
5319 S Mcvicker Ave Chicago, IL 60638
Garfield Ridge NeighborhoodEstimated Value: $333,000 - $415,000
4
Beds
1
Bath
1,250
Sq Ft
$292/Sq Ft
Est. Value
About This Home
This home is located at 5319 S Mcvicker Ave, Chicago, IL 60638 and is currently estimated at $364,883, approximately $291 per square foot. 5319 S Mcvicker Ave is a home located in Cook County with nearby schools including Twain Elementary School, Kennedy High School, and Gloria Dei Lutheran School.
Ownership History
Date
Name
Owned For
Owner Type
Purchase Details
Closed on
Dec 28, 2007
Sold by
Wudarski Chester J and Wudarski Carolynn
Bought by
Bockhol Terrance L
Current Estimated Value
Home Financials for this Owner
Home Financials are based on the most recent Mortgage that was taken out on this home.
Original Mortgage
$228,000
Outstanding Balance
$144,741
Interest Rate
6.27%
Mortgage Type
Unknown
Estimated Equity
$220,142
Purchase Details
Closed on
Dec 20, 2007
Sold by
Stull Susan and Arendt Susan
Bought by
Bockhol Terrance L
Home Financials for this Owner
Home Financials are based on the most recent Mortgage that was taken out on this home.
Original Mortgage
$228,000
Outstanding Balance
$144,741
Interest Rate
6.27%
Mortgage Type
Unknown
Estimated Equity
$220,142
Purchase Details
Closed on
Jul 19, 2004
Sold by
Smirniotis Sylvia
Bought by
Marquette Bank and Trust #17216
Purchase Details
Closed on
Feb 5, 2004
Sold by
Arendt Jon
Bought by
Smirniotis Sylvia
Create a Home Valuation Report for This Property
The Home Valuation Report is an in-depth analysis detailing your home's value as well as a comparison with similar homes in the area
Home Values in the Area
Average Home Value in this Area
Purchase History
| Date | Buyer | Sale Price | Title Company |
|---|---|---|---|
| Bockhol Terrance L | -- | Cti | |
| Bockhol Terrance L | $228,000 | Cti | |
| Bockhol Terrance L | -- | Cti | |
| Marquette Bank | -- | -- | |
| Smirniotis Sylvia | -- | -- |
Source: Public Records
Mortgage History
| Date | Status | Borrower | Loan Amount |
|---|---|---|---|
| Open | Bockhol Terrance L | $228,000 |
Source: Public Records
Tax History Compared to Growth
Tax History
| Year | Tax Paid | Tax Assessment Tax Assessment Total Assessment is a certain percentage of the fair market value that is determined by local assessors to be the total taxable value of land and additions on the property. | Land | Improvement |
|---|---|---|---|---|
| 2024 | $4,388 | $30,000 | $8,379 | $21,621 |
| 2023 | $4,257 | $24,000 | $7,481 | $16,519 |
| 2022 | $4,257 | $24,000 | $7,481 | $16,519 |
| 2021 | $4,156 | $23,999 | $7,481 | $16,518 |
| 2020 | $4,333 | $22,429 | $5,985 | $16,444 |
| 2019 | $4,346 | $24,922 | $5,985 | $18,937 |
| 2018 | $4,272 | $24,922 | $5,985 | $18,937 |
| 2017 | $3,883 | $21,296 | $5,386 | $15,910 |
| 2016 | $3,790 | $21,296 | $5,386 | $15,910 |
| 2015 | $3,447 | $21,296 | $5,386 | $15,910 |
| 2014 | $2,903 | $18,095 | $5,087 | $13,008 |
| 2013 | $2,835 | $18,095 | $5,087 | $13,008 |
Source: Public Records
Map
Nearby Homes
- 5245 S Mayfield Ave
- 5417 S Melvina Ave Unit 102
- 5128 S Meade Ave
- 5850 W 55th St Unit 3D
- 5253 S Mobile Ave
- 5141 S Merrimac Ave
- 5421 S Mulligan Ave
- 6340 S Archer Ave
- 5621 S Moody Ave
- 5533 S Menard Ave
- 5118 S Mobile Ave
- 5108 S Massasoit Ave
- 5142 S Mulligan Ave
- 5248 S Narragansett Ave
- 5712 W 56th St
- 5700 S Monitor Ave
- 5727 S Meade Ave
- 5250 S Nagle Ave
- 5127 S Parkside Ave
- 5121 S Central Ave
- 5315 S Mcvicker Ave
- 5325 S Mcvicker Ave
- 5313 S Mcvicker Ave
- 5329 S Mcvicker Ave
- 5309 S Mcvicker Ave
- 5333 S Mcvicker Ave
- 5318 S Austin Ave
- 5320 S Austin Ave
- 5305 S Mcvicker Ave
- 5314 S Austin Ave
- 5324 S Austin Ave
- 5312 S Austin Ave
- 5335 S Mcvicker Ave
- 5326 S Austin Ave
- 5308 S Austin Ave
- 5330 S Austin Ave
- 5337 S Mcvicker Ave
- 5306 S Austin Ave
- 5332 S Austin Ave
- 5320 S Mcvicker Ave