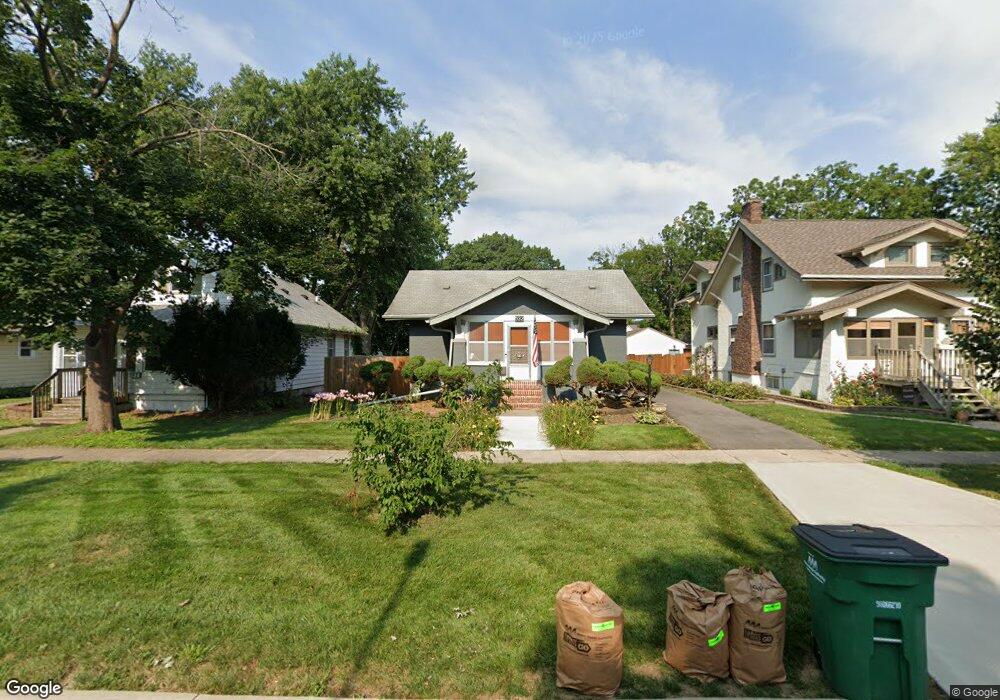
532 3rd St West Des Moines, IA 50265
Estimated Value: $122,000 - $202,000
2
Beds
1
Bath
784
Sq Ft
$211/Sq Ft
Est. Value
About This Home
This home is located at 532 3rd St, West Des Moines, IA 50265 and is currently estimated at $165,070, approximately $210 per square foot. 532 3rd St is a home located in Polk County with nearby schools including Hillside Elementary School, Stilwell Junior High School, and Valley Southwoods Freshman High School.
Ownership History
Date
Name
Owned For
Owner Type
Purchase Details
Closed on
Nov 22, 2022
Sold by
Hartsuck Duncan Carl
Bought by
Salem Jean-Marie Wingfield
Current Estimated Value
Purchase Details
Closed on
Jul 6, 2017
Sold by
Salem Harsuck Jean Marie and Hartsuck Duncan C
Bought by
Salem Hartsuck Jean Marie
Purchase Details
Closed on
Oct 20, 2004
Sold by
Lawnsdail David C
Bought by
Salem Jean Marie and Salem Tony G
Create a Home Valuation Report for This Property
The Home Valuation Report is an in-depth analysis detailing your home's value as well as a comparison with similar homes in the area
Home Values in the Area
Average Home Value in this Area
Purchase History
| Date | Buyer | Sale Price | Title Company |
|---|---|---|---|
| Salem Jean-Marie Wingfield | -- | -- | |
| Salem Hartsuck Jean Marie | -- | None Available | |
| Salem Jean Marie | $67,500 | -- |
Source: Public Records
Tax History Compared to Growth
Tax History
| Year | Tax Paid | Tax Assessment Tax Assessment Total Assessment is a certain percentage of the fair market value that is determined by local assessors to be the total taxable value of land and additions on the property. | Land | Improvement |
|---|---|---|---|---|
| 2025 | $2,068 | $151,800 | $45,600 | $106,200 |
| 2024 | $2,068 | $140,900 | $42,300 | $98,600 |
| 2023 | $1,936 | $140,900 | $42,300 | $98,600 |
| 2022 | $1,910 | $109,100 | $34,000 | $75,100 |
| 2021 | $1,790 | $109,100 | $34,000 | $75,100 |
| 2020 | $1,760 | $97,900 | $30,700 | $67,200 |
| 2019 | $1,606 | $97,900 | $30,700 | $67,200 |
| 2018 | $1,784 | $86,900 | $27,200 | $59,700 |
| 2017 | $1,734 | $86,900 | $27,200 | $59,700 |
| 2016 | $1,696 | $82,000 | $25,400 | $56,600 |
| 2015 | $1,696 | $82,000 | $25,400 | $56,600 |
| 2014 | $1,678 | $80,200 | $24,600 | $55,600 |
Source: Public Records
Map
Nearby Homes