Estimated Value: $424,815
Studio
--
Bath
1,424
Sq Ft
$298/Sq Ft
Est. Value
About This Home
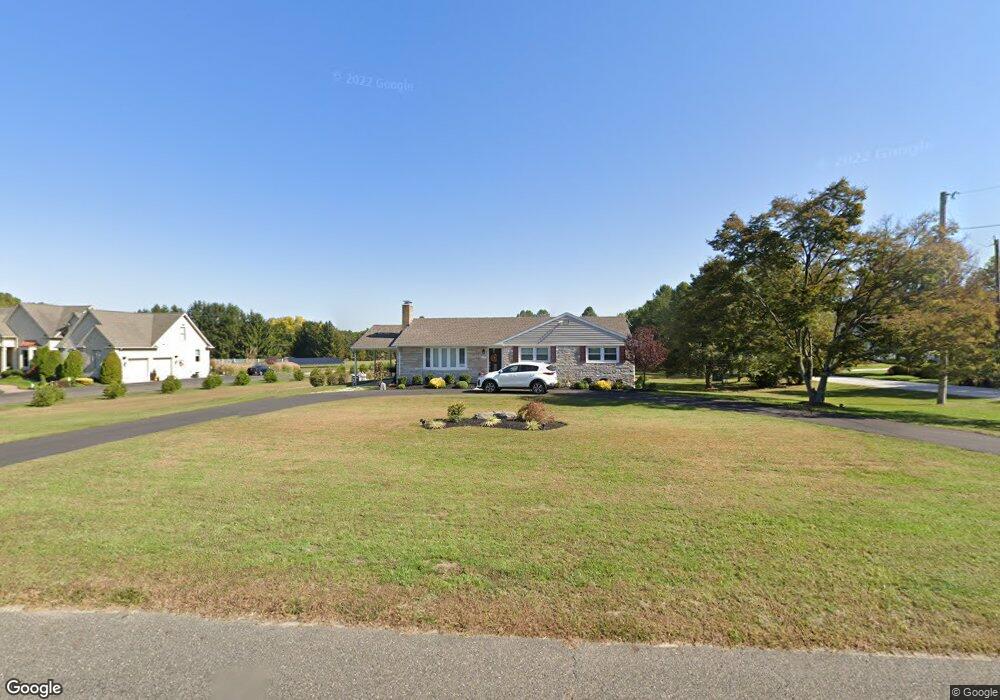
This home is located at 532 5th St, Atco, NJ 08004 and is currently estimated at $424,815, approximately $298 per square foot. 532 5th St is a home with nearby schools including Thomas Richards Elementary School, Waterford Elementary School, and Atco Elementary School.
Ownership History
Date
Name
Owned For
Owner Type
Purchase Details
Closed on
Sep 15, 2020
Sold by
Cavallaro Robert and Cavallaro Deborah
Bought by
Crowther Michael
Current Estimated Value
Home Financials for this Owner
Home Financials are based on the most recent Mortgage that was taken out on this home.
Original Mortgage
$255,000
Interest Rate
2.9%
Mortgage Type
VA
Purchase Details
Closed on
Dec 20, 2016
Sold by
Cavallaro Maria
Bought by
Cavalaro Robert and Cavalaro Deborah
Create a Home Valuation Report for This Property
The Home Valuation Report is an in-depth analysis detailing your home's value as well as a comparison with similar homes in the area
Home Values in the Area
Average Home Value in this Area
Purchase History
| Date | Buyer | Sale Price | Title Company |
|---|---|---|---|
| Crowther Michael | $255,000 | First American Title | |
| Cavalaro Robert | -- | None Available |
Source: Public Records
Mortgage History
| Date | Status | Borrower | Loan Amount |
|---|---|---|---|
| Previous Owner | Crowther Michael | $255,000 |
Source: Public Records
Tax History
| Year | Tax Paid | Tax Assessment Tax Assessment Total Assessment is a certain percentage of the fair market value that is determined by local assessors to be the total taxable value of land and additions on the property. | Land | Improvement |
|---|---|---|---|---|
| 2025 | $7,326 | $170,500 | $50,000 | $120,500 |
| 2024 | $7,326 | $170,500 | $50,000 | $120,500 |
| 2023 | $7,326 | $170,500 | $50,000 | $120,500 |
| 2022 | $7,001 | $170,500 | $50,000 | $120,500 |
| 2021 | $6,714 | $170,500 | $50,000 | $120,500 |
| 2020 | $6,933 | $170,500 | $50,000 | $120,500 |
| 2019 | $6,827 | $170,500 | $50,000 | $120,500 |
| 2018 | $6,820 | $170,500 | $50,000 | $120,500 |
| 2017 | $6,714 | $170,500 | $50,000 | $120,500 |
| 2016 | $6,617 | $170,500 | $50,000 | $120,500 |
| 2015 | $6,193 | $170,500 | $50,000 | $120,500 |
| 2014 | $6,306 | $118,700 | $31,000 | $87,700 |
Source: Public Records
Map
Nearby Homes
- 2371 Bellevue Ave
- 2336 Auburn Ave
- 2470 Medford Rd
- 2311 Gennessee Ave
- 402 Holly Dr
- 344 Raritan Ave
- 2172 Atco Ave
- 2216 Harrison Ave
- 2422 Louden Ln
- 2307 Cooper Rd
- 2157 Almira Ave
- 2408 Louden Ln
- 2317 Cooper Rd
- 687 Jackson Rd
- 2107 Cooper Rd
- 622 Jackson Rd
- 2297 Memorial Ct
- 295 White Horse Pike
- 470 Waterfords Edge Ct
- 275 White Horse Pike
Your Personal Tour Guide
Ask me questions while you tour the home.