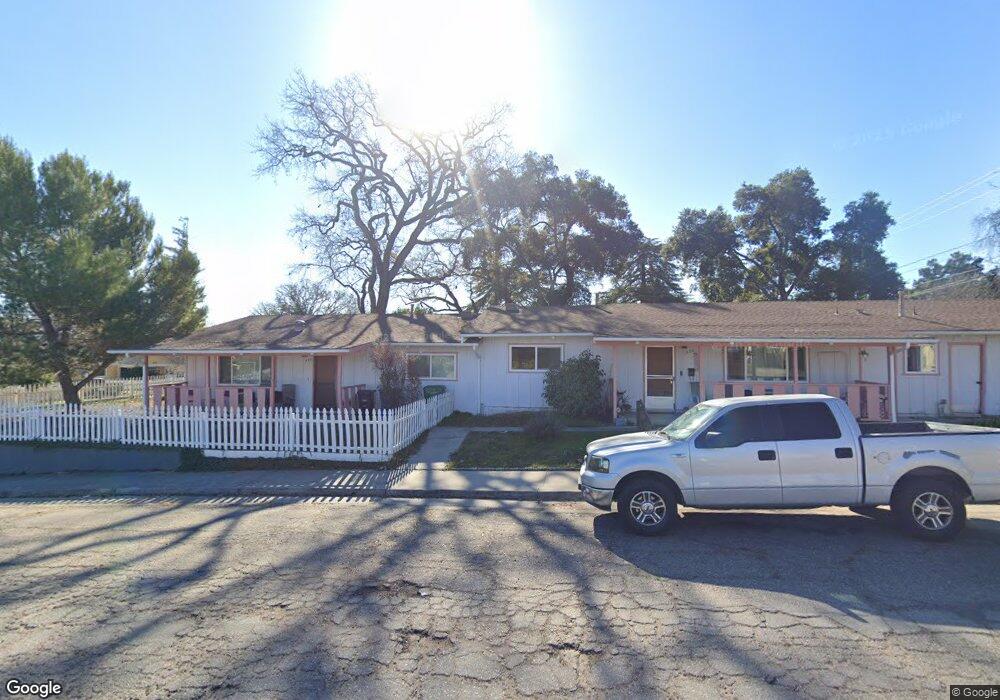
532 7th St Paso Robles, CA 93446
Estimated Value: $778,000 - $812,957
4
Beds
4
Baths
2,280
Sq Ft
$348/Sq Ft
Est. Value
About This Home
This home is located at 532 7th St, Paso Robles, CA 93446 and is currently estimated at $793,989, approximately $348 per square foot. 532 7th St is a home located in San Luis Obispo County with nearby schools including Glen Speck Elementary School, George H. Flamson Middle School, and Paso Robles High School.
Ownership History
Date
Name
Owned For
Owner Type
Purchase Details
Closed on
Mar 11, 2025
Sold by
Bruce David R
Bought by
David R Bruce And Ellen M Bruce Revocable Liv and Bruce
Current Estimated Value
Purchase Details
Closed on
Mar 9, 2024
Sold by
Phyllis S Chiado 2006 Revocable Trust and Bruce John E
Bought by
John E Bruce 2021 Separate Property Trust and Bruce-Aijian David M
Purchase Details
Closed on
Apr 29, 2021
Sold by
Bruce John E and Bruce Shirley M
Bought by
Bruce John E and Bruce Aijian David
Purchase Details
Closed on
Nov 6, 2006
Sold by
Bruce Shirley M and Bruce Shirley
Bought by
Bruce Shirley M and Shirley M Bruce 2006 Revocable
Purchase Details
Closed on
Oct 2, 2006
Sold by
Chiado Phyllis S and Chiado Phyllis
Bought by
Chiado Phyllis S and Chiado 2006 Revocabl Phyllis S
Create a Home Valuation Report for This Property
The Home Valuation Report is an in-depth analysis detailing your home's value as well as a comparison with similar homes in the area
Purchase History
| Date | Buyer | Sale Price | Title Company |
|---|---|---|---|
| David R Bruce And Ellen M Bruce Revocable Liv | -- | None Listed On Document | |
| John E Bruce 2021 Separate Property Trust | -- | None Listed On Document | |
| Bruce John E | -- | None Available | |
| Bruce Shirley M | -- | None Available | |
| Chiado Phyllis S | -- | None Available |
Source: Public Records
Tax History
| Year | Tax Paid | Tax Assessment Tax Assessment Total Assessment is a certain percentage of the fair market value that is determined by local assessors to be the total taxable value of land and additions on the property. | Land | Improvement |
|---|---|---|---|---|
| 2025 | $6,215 | $570,248 | $291,889 | $278,359 |
| 2024 | $3,615 | $559,067 | $286,166 | $272,901 |
| 2023 | $3,615 | $324,038 | $151,703 | $172,335 |
| 2022 | $1,120 | $99,879 | $16,963 | $82,916 |
| 2021 | $1,100 | $97,922 | $16,631 | $81,291 |
| 2020 | $1,085 | $96,919 | $16,461 | $80,458 |
| 2019 | $1,070 | $95,020 | $16,139 | $78,881 |
| 2018 | $1,056 | $93,158 | $15,823 | $77,335 |
| 2017 | $993 | $91,332 | $15,513 | $75,819 |
| 2016 | $973 | $89,542 | $15,209 | $74,333 |
| 2015 | $969 | $88,198 | $14,981 | $73,217 |
| 2014 | $936 | $86,471 | $14,688 | $71,783 |
Source: Public Records
Map
Nearby Homes
Your Personal Tour Guide
Ask me questions while you tour the home.