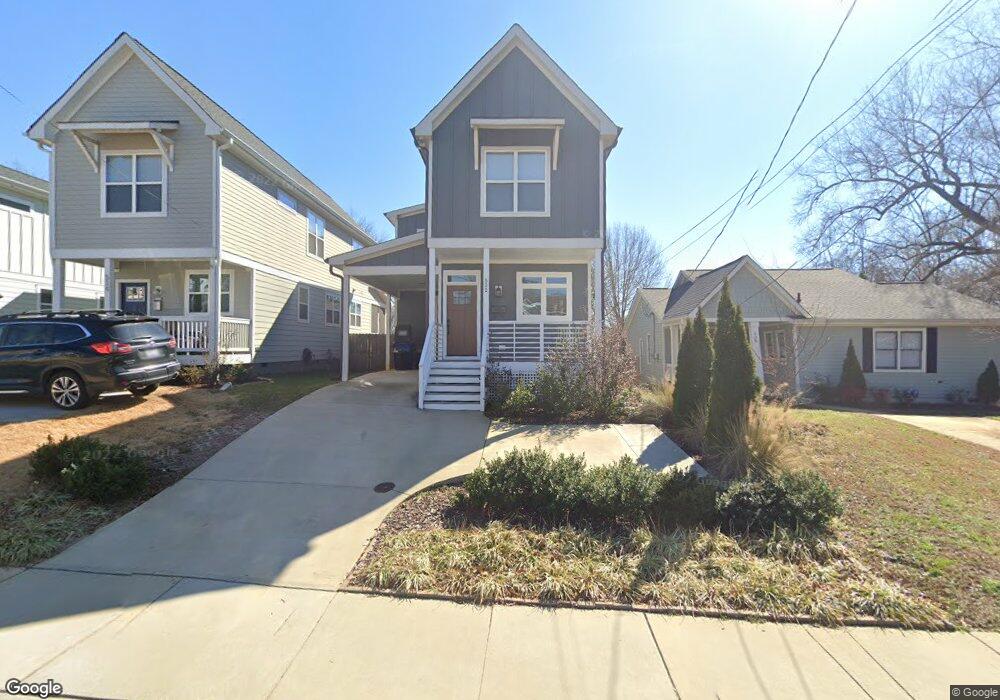
532 E Lenoir St Raleigh, NC 27601
Olde East Raleigh NeighborhoodEstimated Value: $508,000 - $583,000
Studio
1
Bath
1,436
Sq Ft
$384/Sq Ft
Est. Value
About This Home
This home is located at 532 E Lenoir St, Raleigh, NC 27601 and is currently estimated at $551,347, approximately $383 per square foot. 532 E Lenoir St is a home located in Wake County with nearby schools including Hunter Elementary School, Ligon Magnet Middle School, and Broughton Magnet High School.
Ownership History
Date
Name
Owned For
Owner Type
Purchase Details
Closed on
Aug 23, 2017
Sold by
Mebane William Battle and Mebane Elaine B
Bought by
Mebane Kemp B
Current Estimated Value
Home Financials for this Owner
Home Financials are based on the most recent Mortgage that was taken out on this home.
Original Mortgage
$192,000
Outstanding Balance
$160,209
Interest Rate
3.96%
Mortgage Type
New Conventional
Estimated Equity
$391,138
Purchase Details
Closed on
Nov 1, 2016
Sold by
Gupta Bhola N and Gupta Radha L
Bought by
Mebane William Battle
Purchase Details
Closed on
Feb 21, 2002
Sold by
Adams Charles D and Adams Cora Lee
Bought by
Gupta Bhola N
Home Financials for this Owner
Home Financials are based on the most recent Mortgage that was taken out on this home.
Original Mortgage
$15,000
Interest Rate
7.02%
Mortgage Type
Seller Take Back
Create a Home Valuation Report for This Property
The Home Valuation Report is an in-depth analysis detailing your home's value as well as a comparison with similar homes in the area
Home Values in the Area
Average Home Value in this Area
Purchase History
| Date | Buyer | Sale Price | Title Company |
|---|---|---|---|
| Mebane Kemp B | $240,000 | Metro Title Co | |
| Mebane William Battle | $117,000 | None Available | |
| Gupta Bhola N | $35,000 | -- |
Source: Public Records
Mortgage History
| Date | Status | Borrower | Loan Amount |
|---|---|---|---|
| Open | Mebane Kemp B | $192,000 | |
| Previous Owner | Gupta Bhola N | $15,000 |
Source: Public Records
Tax History
| Year | Tax Paid | Tax Assessment Tax Assessment Total Assessment is a certain percentage of the fair market value that is determined by local assessors to be the total taxable value of land and additions on the property. | Land | Improvement |
|---|---|---|---|---|
| 2025 | $5,092 | $581,564 | $285,000 | $296,564 |
| 2024 | $5,071 | $581,564 | $285,000 | $296,564 |
Source: Public Records
Map
Nearby Homes
- 612 E South St
- 413 Watson St
- 511 S Bloodworth St Unit 101
- 501 S Bloodworth St Unit 103
- 501 S Bloodworth St Unit 102
- 520 S Bloodworth St
- 603 E Cabarrus St
- 320 E Cabarrus St
- 620 E Davie St
- 316 E Cabarrus St
- 405 Alston St
- 511 Alston St
- 709 E Lenoir St Unit 201
- 709 E Lenoir St Unit 304
- 709 E Lenoir St Unit 100
- 413 Alston St Unit 102
- 409 Alston St
- 409 Alston St Unit 101
- 409 Alston St Unit 102
- 708 Ellington St
- 534 E Lenoir St
- 528 E Lenoir St
- 536 E Lenoir St
- 601 E South St
- 538 E Lenoir St
- 0 E Lenoir St Unit 1735470
- 204-206 E Lenoir St
- 0 E Lenoir St Unit 14 TR1735470
- 204-206 E Lenoir St Unit 601,206
- 703 E Lenoir St
- 603 E South St
- 540 E Lenoir St
- 605 E South St
- 539 E Lenoir St
- 608 Wynne St
- 535 E Lenoir St
- 537 E Lenoir St
- 612 Wynne St
- 542 E Lenoir St
- 533 E Lenoir St
Your Personal Tour Guide
Ask me questions while you tour the home.