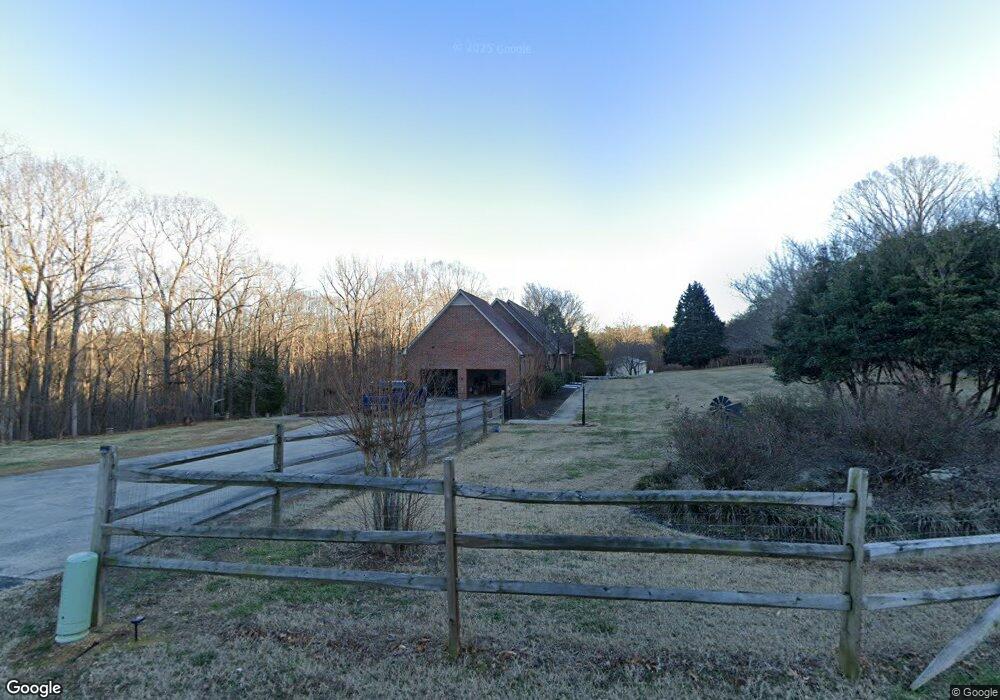
532 Gingles Farm Trail Unit 9 Gastonia, NC 28052
Estimated Value: $714,000 - $876,179
4
Beds
4
Baths
6,068
Sq Ft
$128/Sq Ft
Est. Value
About This Home
This home is located at 532 Gingles Farm Trail Unit 9, Gastonia, NC 28052 and is currently estimated at $775,045, approximately $127 per square foot. 532 Gingles Farm Trail Unit 9 is a home located in Gaston County with nearby schools including Chapel Grove Elementary School, Southwest Middle School, and Hunter Huss High School.
Ownership History
Date
Name
Owned For
Owner Type
Purchase Details
Closed on
Mar 12, 2021
Sold by
Hafford Carl and Hafford Lorena
Bought by
Nobles Nicholas and Nobles Sarah
Current Estimated Value
Home Financials for this Owner
Home Financials are based on the most recent Mortgage that was taken out on this home.
Original Mortgage
$508,500
Outstanding Balance
$455,834
Interest Rate
2.7%
Mortgage Type
New Conventional
Estimated Equity
$319,211
Purchase Details
Closed on
May 8, 2020
Sold by
Gingles Juanita Lowery
Bought by
Hafford Carl and Hafford Lorena
Home Financials for this Owner
Home Financials are based on the most recent Mortgage that was taken out on this home.
Original Mortgage
$446,500
Interest Rate
3.5%
Mortgage Type
New Conventional
Purchase Details
Closed on
Dec 1, 1987
Bought by
Gingles Ralph C and Gingles Juanita L
Create a Home Valuation Report for This Property
The Home Valuation Report is an in-depth analysis detailing your home's value as well as a comparison with similar homes in the area
Home Values in the Area
Average Home Value in this Area
Purchase History
| Date | Buyer | Sale Price | Title Company |
|---|---|---|---|
| Nobles Nicholas | $565,000 | None Available | |
| Hafford Carl | $470,000 | None Available | |
| Gingles Ralph C | -- | -- |
Source: Public Records
Mortgage History
| Date | Status | Borrower | Loan Amount |
|---|---|---|---|
| Open | Nobles Nicholas | $508,500 | |
| Previous Owner | Hafford Carl | $446,500 |
Source: Public Records
Tax History Compared to Growth
Tax History
| Year | Tax Paid | Tax Assessment Tax Assessment Total Assessment is a certain percentage of the fair market value that is determined by local assessors to be the total taxable value of land and additions on the property. | Land | Improvement |
|---|---|---|---|---|
| 2025 | $4,875 | $682,710 | $56,320 | $626,390 |
| 2024 | $4,875 | $682,710 | $56,320 | $626,390 |
| 2023 | $4,745 | $682,710 | $56,320 | $626,390 |
| 2022 | $4,019 | $436,830 | $43,410 | $393,420 |
| 2021 | $4,032 | $436,830 | $43,410 | $393,420 |
| 2020 | $3,660 | $396,540 | $43,410 | $353,130 |
| 2019 | $3,700 | $396,540 | $43,410 | $353,130 |
| 2018 | $2,999 | $307,574 | $37,155 | $270,419 |
| 2017 | $2,973 | $304,874 | $37,155 | $267,719 |
| 2016 | $2,973 | $304,874 | $0 | $0 |
| 2014 | $3,345 | $346,650 | $40,218 | $306,432 |
Source: Public Records
Map
Nearby Homes
- 618 Camp Rotary Rd
- 2311 Maplewood Dr
- 2334 Woodleaf Dr
- 4814 Chapel Grove Rd
- 949 Carson Rd
- 4901 Chapel Grove Rd
- 4201 Graceway Dr
- 4007 Brookstone Ct
- 3402 Rollingwood Dr
- 1234 Laurel Woods Dr
- 1314 Shady Oak Trail
- 2829 Westmont Dr
- 2823 Westmont Dr
- 2817 Westmont Dr
- 2811 Westmont Dr
- 2808 Westmont Dr
- 2802 Westmont Dr
- 3502 Chapel Grove School Rd
- 3431 Pikes Peak Dr
- Dayton Plan at
- 532 Gingles Farm Trail
- 0 Quailcrest Ln Unit 3238373
- 0 Quailcrest Ln Unit 3238361
- 0 Quailcrest Ln Unit 3238291
- 0 Quailcrest Ln Unit 3254130
- 232 Quailcrest Ln
- 213 Quailcrest Ln
- 202 Quailcrest Ln
- 231 Quailcrest Ln
- 535 Gingles Farm Trail
- 535 Gingles Farm Trail Unit 10
- 2909 Old Stage Rd
- 2907 Old Stage Rd
- 2905 Old Stage Rd
- 126 Quailcrest Ln Unit L 3
- 2911 Old Stage Rd
- 2910 Old Stage Rd
- 4600 Chapel Grove Rd
- 4600 Chapel Grove Rd
- 2913 Old Stage Rd