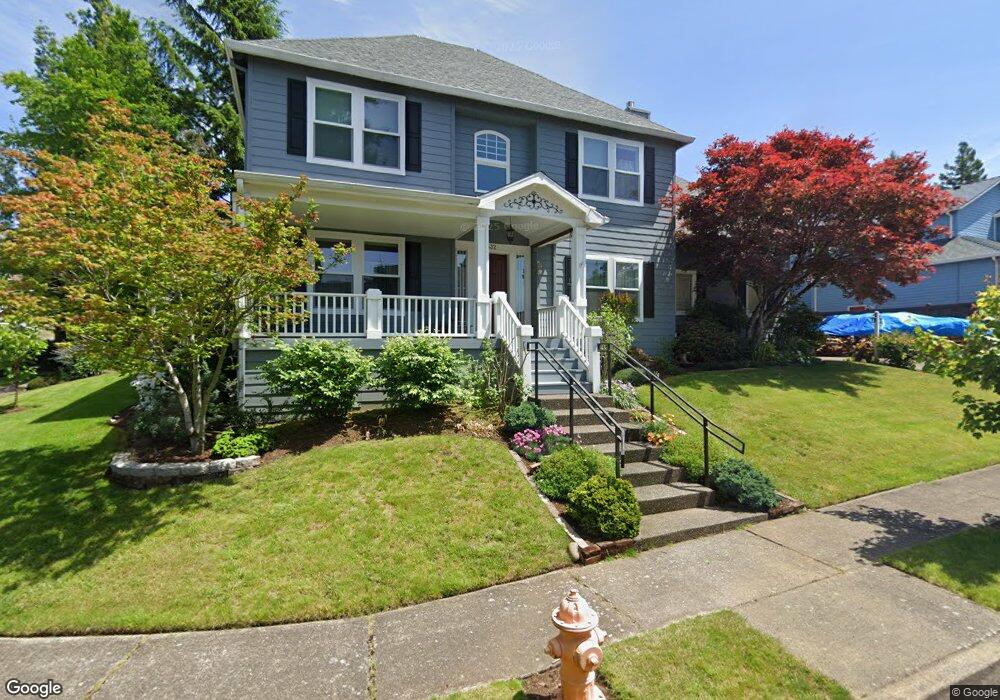
532 NW Mawrcrest Place Gresham, OR 97030
Northwest Gresham NeighborhoodEstimated Value: $540,000 - $570,000
3
Beds
3
Baths
2,200
Sq Ft
$251/Sq Ft
Est. Value
About This Home
This home is located at 532 NW Mawrcrest Place, Gresham, OR 97030 and is currently estimated at $553,083, approximately $251 per square foot. 532 NW Mawrcrest Place is a home located in Multnomah County with nearby schools including North Gresham Elementary School, Clear Creek Middle School, and Gresham High School.
Ownership History
Date
Name
Owned For
Owner Type
Purchase Details
Closed on
Feb 24, 2012
Sold by
Rogoveanu Samuel
Bought by
Meier Kenneth and Meier Jacqueline
Current Estimated Value
Home Financials for this Owner
Home Financials are based on the most recent Mortgage that was taken out on this home.
Original Mortgage
$60,000
Outstanding Balance
$40,838
Interest Rate
3.83%
Mortgage Type
New Conventional
Estimated Equity
$512,245
Purchase Details
Closed on
Jun 4, 2004
Sold by
Torres Teresa M
Bought by
Rogoveanu Samuel
Home Financials for this Owner
Home Financials are based on the most recent Mortgage that was taken out on this home.
Original Mortgage
$192,000
Interest Rate
5.92%
Mortgage Type
Purchase Money Mortgage
Purchase Details
Closed on
Feb 2, 1995
Sold by
Lee Mark E
Bought by
Torres Teresa M
Home Financials for this Owner
Home Financials are based on the most recent Mortgage that was taken out on this home.
Original Mortgage
$170,500
Interest Rate
7.5%
Mortgage Type
Purchase Money Mortgage
Create a Home Valuation Report for This Property
The Home Valuation Report is an in-depth analysis detailing your home's value as well as a comparison with similar homes in the area
Home Values in the Area
Average Home Value in this Area
Purchase History
| Date | Buyer | Sale Price | Title Company |
|---|---|---|---|
| Meier Kenneth | $249,900 | First American Title | |
| Rogoveanu Samuel | $247,000 | First American | |
| Torres Teresa M | $189,500 | Ticor Title Insurance |
Source: Public Records
Mortgage History
| Date | Status | Borrower | Loan Amount |
|---|---|---|---|
| Open | Meier Kenneth | $60,000 | |
| Previous Owner | Rogoveanu Samuel | $192,000 | |
| Previous Owner | Torres Teresa M | $170,500 |
Source: Public Records
Tax History Compared to Growth
Tax History
| Year | Tax Paid | Tax Assessment Tax Assessment Total Assessment is a certain percentage of the fair market value that is determined by local assessors to be the total taxable value of land and additions on the property. | Land | Improvement |
|---|---|---|---|---|
| 2025 | $6,735 | $330,960 | -- | -- |
| 2024 | $6,447 | $321,330 | -- | -- |
| 2023 | $6,447 | $311,980 | $0 | $0 |
| 2022 | $5,710 | $302,900 | $0 | $0 |
| 2021 | $5,566 | $294,080 | $0 | $0 |
| 2020 | $5,237 | $285,520 | $0 | $0 |
| 2019 | $5,100 | $277,210 | $0 | $0 |
| 2018 | $4,863 | $269,140 | $0 | $0 |
| 2017 | $4,666 | $261,310 | $0 | $0 |
| 2016 | $4,114 | $253,700 | $0 | $0 |
| 2015 | $4,005 | $246,320 | $0 | $0 |
| 2014 | $3,856 | $239,150 | $0 | $0 |
Source: Public Records
Map
Nearby Homes
- 0 NW Mawrcrest Dr Unit 35-36 354362673
- 0 NW Mawrcrest Dr Unit 31-34
- 0 NW Mawrcrest Dr Unit 8-11 152456654
- 0 NW Mawrcrest Dr Unit 27-30 621615619
- 2360 NW 3rd St
- 2514 NW 3rd Terrace
- 284 NW Mawrcrest Ave
- 296 NW Mawrcrest Ave
- 815 NW Battaglia Ave
- 249 NW Battaglia Ave
- 2590 NW 2nd Terrace
- 2591 NW 1st Dr
- 181 SW Mawrcrest Ave
- 185 SW Mawrcrest Ave
- 67 NW Orchard Place
- 3412 NW 1st St
- 421 SW Lillyben Ave
- 65 SW Pleasant View Ave
- 2442 SE 190th Ave
- 215 SW Towle Ave
- 552 NW Mawrcrest Place
- 502 NW Mawrcrest Place
- 511 NW Mawrcrest Place
- 2329 NW 5th St
- 562 NW Mawrcrest Place
- 541 NW Mawrcrest Place
- 501 NW Mawrcrest Place
- 521 NW Mawrcrest Place
- 551 NW Mawrcrest Place
- 531 NW Mawrcrest Place
- 2309 NW 5th St
- 561 NW Mawrcrest Place
- 550 NW Eleven Mile Ct
- 600 NW Eleven Mile Ct
- 572 NW Mawrcrest Place
- 2410 NW 5th St
- 2380 NW 7th Place
- 2420 NW 7th Place
- 2400 NW 5th St
- 2360 NW 7th Place