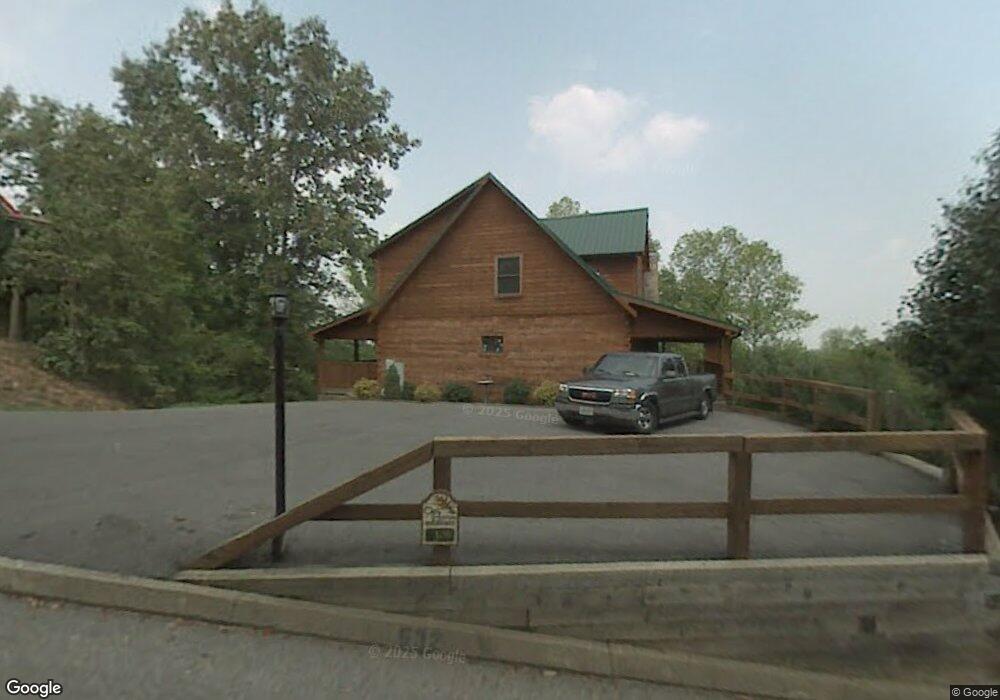
532 Red Cedar Ridge Rd Sevierville, TN 37876
Estimated Value: $677,474
--
Bed
5
Baths
2,176
Sq Ft
$311/Sq Ft
Est. Value
About This Home
This home is located at 532 Red Cedar Ridge Rd, Sevierville, TN 37876 and is currently estimated at $677,474, approximately $311 per square foot. 532 Red Cedar Ridge Rd is a home located in Sevier County with nearby schools including Northview Elementary School, Catons Chapel Elementary School, and Jones Cove Elementary School.
Ownership History
Date
Name
Owned For
Owner Type
Purchase Details
Closed on
Sep 17, 2012
Sold by
Muir Earl B
Bought by
Muir Linda L and Muir Linda L Family Trust
Current Estimated Value
Purchase Details
Closed on
Jul 9, 2012
Sold by
Muir Linda L
Bought by
Muir Earl B and Muir Linda L
Purchase Details
Closed on
Mar 18, 2003
Sold by
Muir Linda L Trustee
Bought by
Muir Earl B
Home Financials for this Owner
Home Financials are based on the most recent Mortgage that was taken out on this home.
Original Mortgage
$300,000
Interest Rate
5.82%
Purchase Details
Closed on
Jan 10, 2002
Sold by
Muir Earl B and Muir Linda L
Bought by
Muir Linda L Trustee
Purchase Details
Closed on
Nov 8, 2001
Sold by
Johnson Charlie R Tr
Bought by
Muir Earl B
Home Financials for this Owner
Home Financials are based on the most recent Mortgage that was taken out on this home.
Original Mortgage
$56,250
Interest Rate
6.57%
Create a Home Valuation Report for This Property
The Home Valuation Report is an in-depth analysis detailing your home's value as well as a comparison with similar homes in the area
Home Values in the Area
Average Home Value in this Area
Purchase History
| Date | Buyer | Sale Price | Title Company |
|---|---|---|---|
| Muir Linda L | -- | -- | |
| Muir Earl B | -- | -- | |
| Muir Earl B | -- | -- | |
| Muir Linda L Trustee | -- | -- | |
| Muir Earl B | $75,000 | -- |
Source: Public Records
Mortgage History
| Date | Status | Borrower | Loan Amount |
|---|---|---|---|
| Previous Owner | Muir Earl B | $300,000 | |
| Previous Owner | Muir Earl B | $56,250 |
Source: Public Records
Tax History Compared to Growth
Tax History
| Year | Tax Paid | Tax Assessment Tax Assessment Total Assessment is a certain percentage of the fair market value that is determined by local assessors to be the total taxable value of land and additions on the property. | Land | Improvement |
|---|---|---|---|---|
| 2025 | $5,658 | $191,120 | $30,000 | $161,120 |
| 2024 | $5,658 | $191,120 | $30,000 | $161,120 |
| 2023 | $5,658 | $191,120 | $0 | $0 |
| 2022 | $2,276 | $119,450 | $18,750 | $100,700 |
| 2021 | $2,276 | $119,450 | $18,750 | $100,700 |
| 2020 | $2,196 | $119,450 | $18,750 | $100,700 |
| 2019 | $2,196 | $93,175 | $18,750 | $74,425 |
| 2018 | $2,196 | $93,175 | $18,750 | $74,425 |
| 2017 | $2,196 | $93,175 | $18,750 | $74,425 |
| 2016 | $2,022 | $93,175 | $18,750 | $74,425 |
| 2015 | -- | $94,500 | $0 | $0 |
| 2014 | $1,833 | $94,494 | $0 | $0 |
Source: Public Records
Map
Nearby Homes
- 536 Red Cedar Ridge Rd
- 320 Oak Haven Way
- 347 Oak Haven Way
- 351 Oak Haven Way
- 1371 Lake Haven Way
- 2040 Whispering Pines Way
- 2215 Island Blvd
- 2319 Island Blvd
- 3344 Frontier View Dr
- 3340 Frontier View Dr
- 2 Winfield Dunn Pkwy
- 0 Leatherwood Rd Unit 1291540
- 1434 Reedmont Way
- 1325 Reedmont Way
- 1317 Reedmont Way
- 1226 Reedmont Way
- 225 Bobwhite Trail
- 1322 Reedmont Way
- 1222 Reedmont Way
- 1409 Reedmont Way
- 526 Red Cedar Ridge Rd
- 522 Red Cedar Ridge Rd
- 302 Oak Haven Way
- 324 Oak Haven Way
- 520 Red Cedar Ridge Rd
- 306 Oak Haven Way
- 338 Oak Haven Way
- 316 Oak Haven Way
- 276 Oak Haven Way
- 518 Red Cedar Ridge Rd
- 335 Oak Haven Way
- 329 Oak Haven Way
- 273 Oak Haven Way
- 0 Oak Haven Way
- Lot 3 Oak Haven Way
- 342 Oak Haven Way
- Tract 3 Tall Oak Way
- 325 Oak Haven Way
- 553 Red Cedar Ridge Rd
- 272 Oak Haven Way