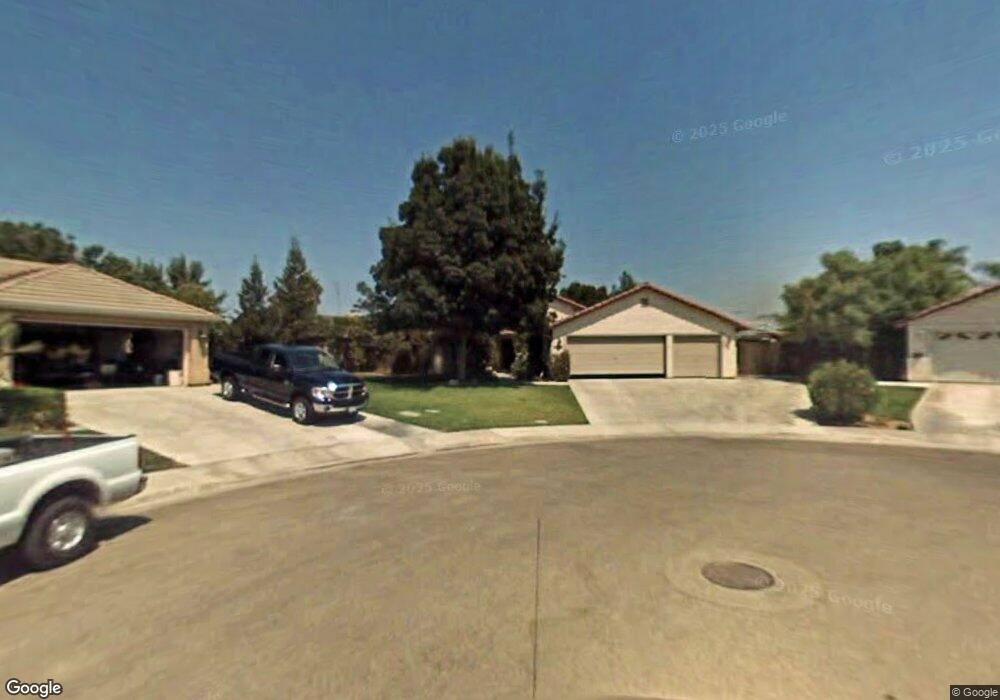
5320 W Ashland Ct Visalia, CA 93277
Estimated Value: $355,643 - $396,000
4
Beds
1
Bath
1,522
Sq Ft
$243/Sq Ft
Est. Value
About This Home
This home is located at 5320 W Ashland Ct, Visalia, CA 93277 and is currently estimated at $370,161, approximately $243 per square foot. 5320 W Ashland Ct is a home located in Tulare County with nearby schools including Linwood Elementary School, La Joya Middle School, and El Diamante High School.
Ownership History
Date
Name
Owned For
Owner Type
Purchase Details
Closed on
Aug 27, 2021
Sold by
Drake Dale O
Bought by
Drake Dale O and Drake Dale O
Current Estimated Value
Purchase Details
Closed on
May 12, 2006
Sold by
Drake Deanna L
Bought by
Drake Dale O
Home Financials for this Owner
Home Financials are based on the most recent Mortgage that was taken out on this home.
Original Mortgage
$232,500
Outstanding Balance
$135,116
Interest Rate
6.46%
Mortgage Type
Fannie Mae Freddie Mac
Estimated Equity
$235,045
Purchase Details
Closed on
Apr 5, 1996
Sold by
Centex Real Estate Corp
Bought by
Drake Dale O and Drake Deanna L
Home Financials for this Owner
Home Financials are based on the most recent Mortgage that was taken out on this home.
Original Mortgage
$119,939
Interest Rate
8.01%
Mortgage Type
FHA
Create a Home Valuation Report for This Property
The Home Valuation Report is an in-depth analysis detailing your home's value as well as a comparison with similar homes in the area
Home Values in the Area
Average Home Value in this Area
Purchase History
| Date | Buyer | Sale Price | Title Company |
|---|---|---|---|
| Drake Dale O | -- | None Available | |
| Drake Dale O | -- | Stewart Title Of California | |
| Drake Dale O | $124,500 | Chicago Title Co |
Source: Public Records
Mortgage History
| Date | Status | Borrower | Loan Amount |
|---|---|---|---|
| Open | Drake Dale O | $232,500 | |
| Previous Owner | Drake Dale O | $119,939 |
Source: Public Records
Tax History Compared to Growth
Tax History
| Year | Tax Paid | Tax Assessment Tax Assessment Total Assessment is a certain percentage of the fair market value that is determined by local assessors to be the total taxable value of land and additions on the property. | Land | Improvement |
|---|---|---|---|---|
| 2025 | $2,542 | $218,889 | $66,453 | $152,436 |
| 2024 | $2,542 | $214,598 | $65,150 | $149,448 |
| 2023 | $2,457 | $210,391 | $63,873 | $146,518 |
| 2022 | $2,338 | $206,267 | $62,621 | $143,646 |
| 2021 | $2,341 | $202,222 | $61,393 | $140,829 |
| 2020 | $2,323 | $200,148 | $60,763 | $139,385 |
| 2019 | $2,244 | $196,224 | $59,572 | $136,652 |
| 2018 | $2,177 | $192,377 | $58,404 | $133,973 |
| 2017 | $2,141 | $188,605 | $57,259 | $131,346 |
| 2016 | $2,071 | $183,000 | $46,000 | $137,000 |
| 2015 | $1,708 | $172,000 | $43,000 | $129,000 |
| 2014 | $1,708 | $157,000 | $39,000 | $118,000 |
Source: Public Records
Map
Nearby Homes
- 5541 W Walnut Ave
- 2826 S Avocado Ct
- 5730 W Laura Ct
- 4746 W Ashland Ave
- 6028 W Evergreen Ave
- 6030 W Country Ct
- 2801 S Kent Ct
- 5746 W Judy Ct
- 3131 S Parkwood St
- 4523 W Evergreen Ct
- The Sherman Plan at Wildflower
- The Pinecrest Plan at Wildflower
- The Granite Ridge Plan at Wildflower
- The Meadowbrook Plan at Wildflower
- The Summit Plan at Wildflower
- 5141 W Chestnut Ave
- 4615 W Feemster Ave
- 4239 W Mary Ave
- 5505 W Tulare Ave Unit 24
- 5505 W Tulare Ave Unit 406
- 2403 S Akers St
- 5319 W Ashland Ct
- 5330 W Ashland Ct
- 2345 S Akers St
- 5327 W Ashland Ct
- 5401 W Mary Ave
- 5335 W Ashland Ct
- 5335 W Ashland Ct
- 2331 S Akers St
- 5400 W Ashland Ct
- 5347 W Ashland Ct
- 5409 W Mary Ave
- 5310 W Cherry Ave
- 5322 W Cherry Ave
- 2326 S Maselli St
- 5328 W Cherry Ave
- 2323 S Akers St
- 5408 W Ashland Ct
- 5338 W Cherry Ave
- 5407 W Ashland Ct