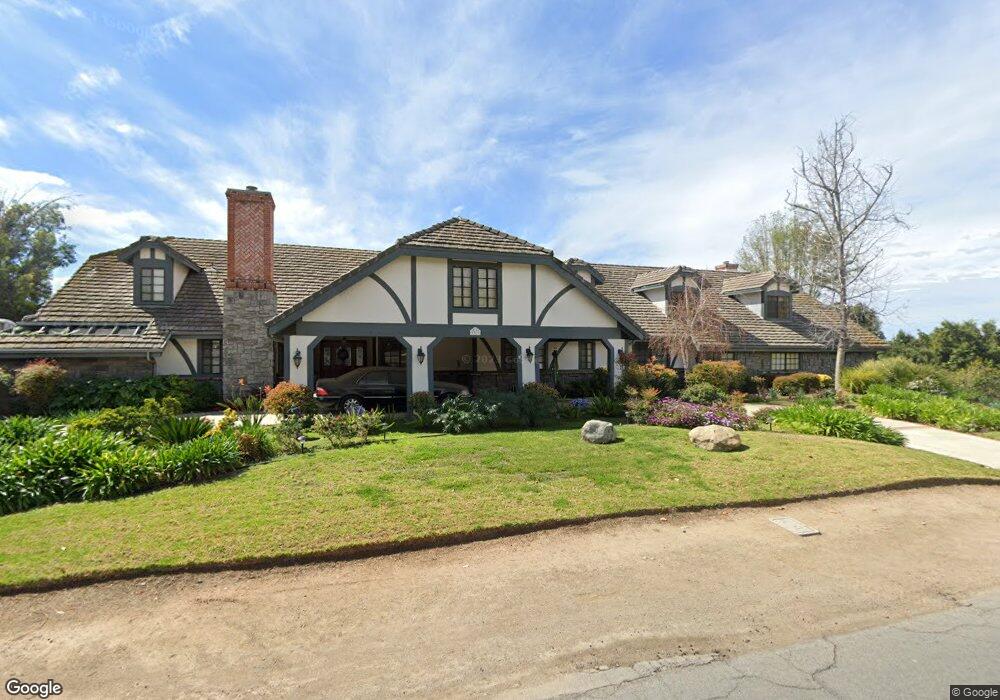
5321 Mountain View Ave Yorba Linda, CA 92886
Estimated Value: $2,686,000 - $4,013,000
4
Beds
4
Baths
5,327
Sq Ft
$620/Sq Ft
Est. Value
About This Home
This home is located at 5321 Mountain View Ave, Yorba Linda, CA 92886 and is currently estimated at $3,303,786, approximately $620 per square foot. 5321 Mountain View Ave is a home located in Orange County with nearby schools including Linda Vista Elementary School, Yorba Linda Middle School, and Friends Christian School.
Ownership History
Date
Name
Owned For
Owner Type
Purchase Details
Closed on
Feb 2, 2023
Sold by
Nelson Diane Mae
Bought by
James Kenneth And Diane Mae Nelson 1992 Famil
Current Estimated Value
Purchase Details
Closed on
Jun 24, 1998
Sold by
Laughlin Francis W
Bought by
Nelson James Kenneth and Nelson Diane Mae
Home Financials for this Owner
Home Financials are based on the most recent Mortgage that was taken out on this home.
Original Mortgage
$500,000
Interest Rate
6.37%
Purchase Details
Closed on
Jan 30, 1996
Sold by
Laughlin Francis Wayne and Laughlin Amy Fumiko
Bought by
Laughlin Francis W and Laughlin Amy F
Home Financials for this Owner
Home Financials are based on the most recent Mortgage that was taken out on this home.
Original Mortgage
$590,500
Interest Rate
6.87%
Purchase Details
Closed on
May 24, 1993
Sold by
Laughlin Francis W and Laughlin Amy F
Bought by
Laughlin Francis W and Laughlin Amy F
Create a Home Valuation Report for This Property
The Home Valuation Report is an in-depth analysis detailing your home's value as well as a comparison with similar homes in the area
Home Values in the Area
Average Home Value in this Area
Purchase History
| Date | Buyer | Sale Price | Title Company |
|---|---|---|---|
| James Kenneth And Diane Mae Nelson 1992 Famil | -- | -- | |
| Nelson James Kenneth | $920,000 | Chicago Title Co | |
| Laughlin Francis W | -- | First American Title Ins Co | |
| Laughlin Francis Wayne | -- | First American Title Ins Co | |
| Laughlin Francis W | -- | -- |
Source: Public Records
Mortgage History
| Date | Status | Borrower | Loan Amount |
|---|---|---|---|
| Previous Owner | Nelson James Kenneth | $500,000 | |
| Previous Owner | Laughlin Francis Wayne | $590,500 |
Source: Public Records
Tax History Compared to Growth
Tax History
| Year | Tax Paid | Tax Assessment Tax Assessment Total Assessment is a certain percentage of the fair market value that is determined by local assessors to be the total taxable value of land and additions on the property. | Land | Improvement |
|---|---|---|---|---|
| 2025 | $15,719 | $1,462,284 | $697,645 | $764,639 |
| 2024 | $15,719 | $1,433,612 | $683,965 | $749,647 |
| 2023 | $15,457 | $1,405,502 | $670,553 | $734,949 |
| 2022 | $15,322 | $1,377,944 | $657,405 | $720,539 |
| 2021 | $15,070 | $1,350,926 | $644,515 | $706,411 |
| 2020 | $15,002 | $1,337,074 | $637,906 | $699,168 |
| 2019 | $14,456 | $1,310,857 | $625,398 | $685,459 |
| 2018 | $14,279 | $1,285,154 | $613,135 | $672,019 |
| 2017 | $14,045 | $1,259,955 | $601,112 | $658,843 |
| 2016 | $13,760 | $1,235,250 | $589,325 | $645,925 |
| 2015 | $13,594 | $1,216,696 | $580,473 | $636,223 |
| 2014 | $13,187 | $1,192,863 | $569,102 | $623,761 |
Source: Public Records
Map
Nearby Homes
- 18571 Buena Vista Ave
- 5371 Grandview Ave
- 18931 Gordon Ln
- 5302 Grandview Ave
- 5729 Grandview Ave
- 5245 Grandview Ave
- 19022 Shamrock Ln
- 4951 Oak Tree Ct
- 5754 Kellogg Dr
- 4760 Lakeview Ave
- 6041 Calle Mirador
- 4712 Yorba Ln
- 6061 Terrace Ln Unit 43
- 18083 Burke Ln
- 6021 Saddletree Ln
- 4741 School St
- 1891 N Garland Ln
- 4642 Ohio St
- 5231 Highland Ave
- 6052 Candle Light Ln
- 5282 Sunset Ln
- 5361 Mountain View Ave
- 5271 Sunset Ln
- 5350 Mountain View Ave
- 5320 Mountain View Ave
- 5371 Mountain View Ave
- 5291 Sunset Ln
- 5373 Mountain View Ave
- 5300 Sunset Ln
- 5372 Mountain View Ave
- 5295 Mountain View Ave
- 5340 Douglas Ln
- 5304 Tedford Way
- 5330 Douglas Ln
- 5311 Mountain View Ave
- 5350 Douglas Ln
- 5377 Mountain View Ave
- 5320 Douglas Ln
- 5362 Lindford Ln
- 5302 Mountain View Ave