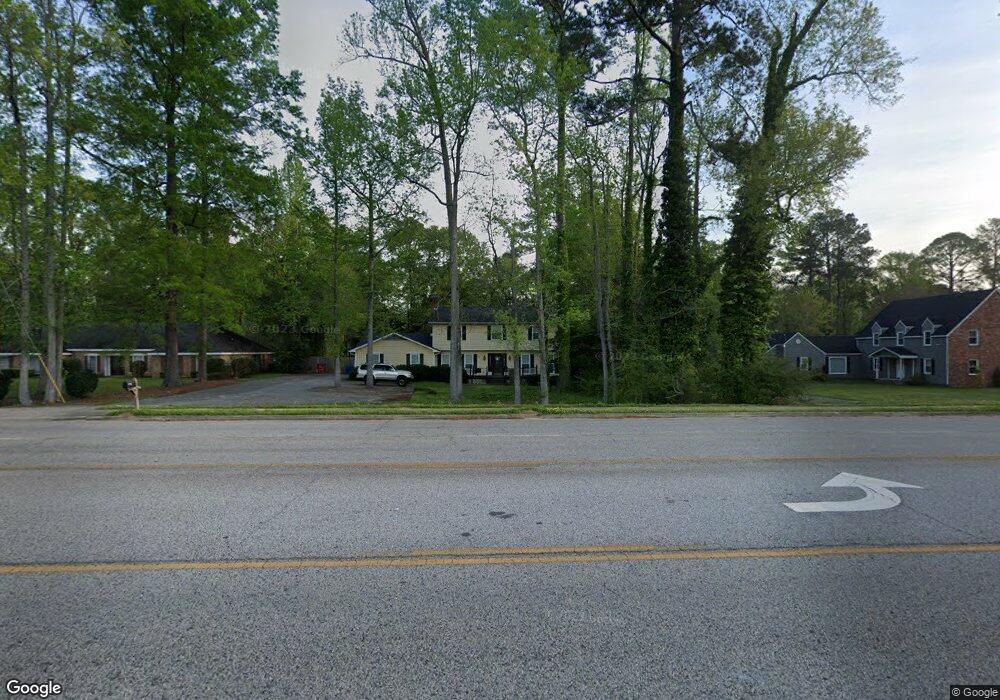
5321 Zebulon Rd Macon, GA 31210
Estimated Value: $195,000 - $262,000
4
Beds
3
Baths
2,222
Sq Ft
$102/Sq Ft
Est. Value
About This Home
This home is located at 5321 Zebulon Rd, Macon, GA 31210 and is currently estimated at $227,247, approximately $102 per square foot. 5321 Zebulon Rd is a home located in Bibb County with nearby schools including Carter Elementary School, Howard Middle School, and Howard High School.
Ownership History
Date
Name
Owned For
Owner Type
Purchase Details
Closed on
Oct 12, 2018
Sold by
Jeffords David George and Jeffords Jessica
Bought by
Moore Ashley Fordham and Moore Grant Keith
Current Estimated Value
Home Financials for this Owner
Home Financials are based on the most recent Mortgage that was taken out on this home.
Original Mortgage
$108,007
Outstanding Balance
$96,145
Interest Rate
5.62%
Mortgage Type
FHA
Estimated Equity
$131,102
Purchase Details
Closed on
Jun 14, 2013
Sold by
Jeffords David George
Bought by
Jeffords David George and Jeffords Jessica
Home Financials for this Owner
Home Financials are based on the most recent Mortgage that was taken out on this home.
Original Mortgage
$104,000
Interest Rate
3.42%
Mortgage Type
New Conventional
Purchase Details
Closed on
Dec 29, 2006
Sold by
Jeffords Sara Elizabeth and Jeffords Elizabeth O
Bought by
Jeffords David George
Purchase Details
Closed on
Dec 12, 2006
Sold by
Jeffords Sara Elizabeth
Bought by
Jeffords David George
Create a Home Valuation Report for This Property
The Home Valuation Report is an in-depth analysis detailing your home's value as well as a comparison with similar homes in the area
Home Values in the Area
Average Home Value in this Area
Purchase History
| Date | Buyer | Sale Price | Title Company |
|---|---|---|---|
| Moore Ashley Fordham | $110,000 | None Available | |
| Jeffords David George | -- | None Available | |
| Jeffords David George | -- | None Available | |
| Jeffords David George | -- | None Available | |
| Jeffords David George | -- | None Available |
Source: Public Records
Mortgage History
| Date | Status | Borrower | Loan Amount |
|---|---|---|---|
| Open | Moore Ashley Fordham | $108,007 | |
| Previous Owner | Jeffords David George | $104,000 |
Source: Public Records
Tax History Compared to Growth
Tax History
| Year | Tax Paid | Tax Assessment Tax Assessment Total Assessment is a certain percentage of the fair market value that is determined by local assessors to be the total taxable value of land and additions on the property. | Land | Improvement |
|---|---|---|---|---|
| 2025 | $1,718 | $76,910 | $13,440 | $63,470 |
| 2024 | $1,776 | $76,910 | $13,440 | $63,470 |
| 2023 | $1,318 | $76,910 | $13,440 | $63,470 |
| 2022 | $2,612 | $82,442 | $11,196 | $71,246 |
| 2021 | $2,588 | $75,102 | $10,178 | $64,924 |
| 2020 | $2,436 | $69,751 | $10,178 | $59,573 |
| 2019 | $1,477 | $63,383 | $9,160 | $54,223 |
| 2018 | $3,517 | $62,663 | $9,160 | $53,503 |
| 2017 | $1,839 | $56,081 | $9,874 | $46,207 |
| 2016 | $1,698 | $56,082 | $9,874 | $46,207 |
| 2015 | $2,644 | $60,982 | $12,343 | $48,639 |
| 2014 | $2,648 | $60,982 | $12,343 | $48,639 |
Source: Public Records
Map
Nearby Homes
- 5181 Zebulon Rd
- 311 Castlegate Rd
- 331 Marjane Dr
- 111 the Vinings
- 106 Trillium Terrace
- 218 Matlock Ln
- 131 Ashford Park
- 105 N Wellington
- 107 N Wellington
- 200 Stone Edge Rd
- 118 Ashford Park
- 670 Middlesex Dr
- 103 Hanover Place
- 163 Broadleaf Dr
- 112 Covington Place
- 133 Covington Place
- 757 Silver Springs Dr
- 5323 Zebulon Rd
- 5319 Zebulon Rd
- 150 Castlegate Rd
- 5317 Zebulon Rd
- 140 Castlegate Rd
- 5477 Zebulon Rd
- 160 Castlegate Rd
- 130 Castlegate Rd
- 110 Castlegate Rd
- 5461 Zebulon Rd
- 120 Castlegate Rd
- 170 Castlegate Rd
- 135 Castlegate Rd
- 181 Marjane Dr
- 145 Castlegate Rd
- 221 Sanders Rd
- 215 Sanders Rd
- 203 Sanders Rd
- 173 Sanders Rd
- 153 Sanders Rd