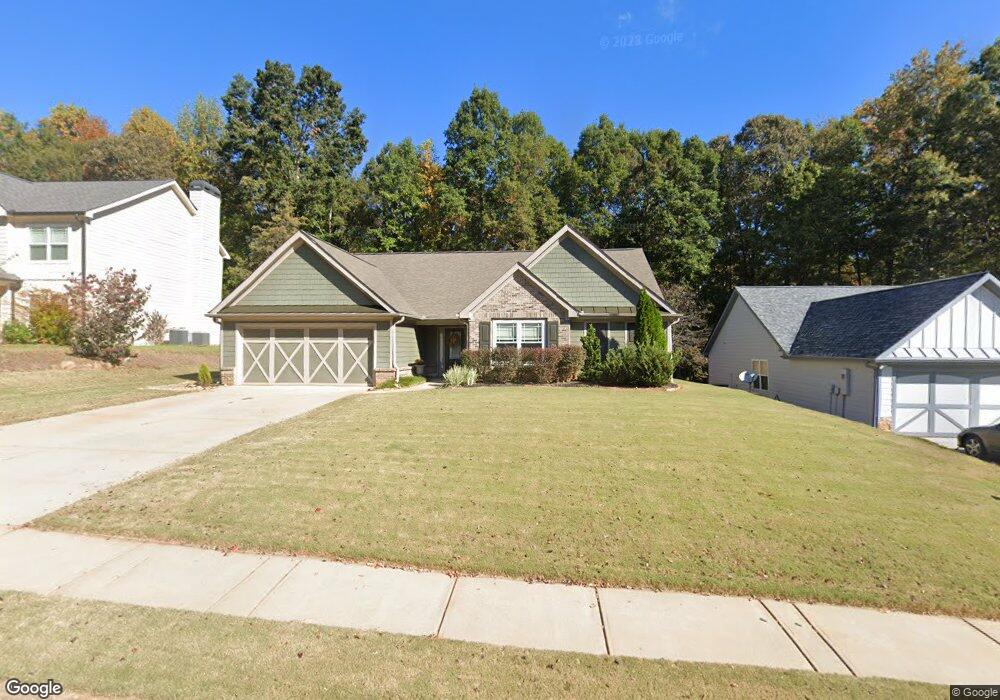
5323 Chastain Way Unit 69 Gainesville, GA 30507
Estimated Value: $366,000 - $446,000
3
Beds
2
Baths
1,808
Sq Ft
$229/Sq Ft
Est. Value
About This Home
This home is located at 5323 Chastain Way Unit 69, Gainesville, GA 30507 and is currently estimated at $413,509, approximately $228 per square foot. 5323 Chastain Way Unit 69 is a home located in Hall County with nearby schools including Chestnut Mountain Elementary School, Cherokee Bluff Middle School, and Cherokee Bluff High School.
Ownership History
Date
Name
Owned For
Owner Type
Purchase Details
Closed on
Mar 5, 2024
Sold by
King Mathew
Bought by
Turner Charlene
Current Estimated Value
Purchase Details
Closed on
May 26, 2016
Sold by
Johnson Stephen
Bought by
King Mathew
Home Financials for this Owner
Home Financials are based on the most recent Mortgage that was taken out on this home.
Original Mortgage
$188,522
Interest Rate
3.58%
Mortgage Type
FHA
Purchase Details
Closed on
Jul 30, 2009
Sold by
Georgian Acres Builders Inc
Bought by
Johnson Stephen and Johnson Jessica
Home Financials for this Owner
Home Financials are based on the most recent Mortgage that was taken out on this home.
Original Mortgage
$176,641
Interest Rate
5.15%
Mortgage Type
FHA
Purchase Details
Closed on
Mar 25, 2008
Sold by
The Balata Development Corporation
Bought by
Georgian Acres Builders Inc
Create a Home Valuation Report for This Property
The Home Valuation Report is an in-depth analysis detailing your home's value as well as a comparison with similar homes in the area
Home Values in the Area
Average Home Value in this Area
Purchase History
| Date | Buyer | Sale Price | Title Company |
|---|---|---|---|
| Turner Charlene | $405,000 | -- | |
| King Mathew | $192,000 | -- | |
| Johnson Stephen | $179,900 | -- | |
| Georgian Acres Builders Inc | $280,000 | -- |
Source: Public Records
Mortgage History
| Date | Status | Borrower | Loan Amount |
|---|---|---|---|
| Previous Owner | King Mathew | $188,522 | |
| Previous Owner | Johnson Stephen | $176,641 |
Source: Public Records
Tax History Compared to Growth
Tax History
| Year | Tax Paid | Tax Assessment Tax Assessment Total Assessment is a certain percentage of the fair market value that is determined by local assessors to be the total taxable value of land and additions on the property. | Land | Improvement |
|---|---|---|---|---|
| 2025 | $4,219 | $170,640 | $36,000 | $134,640 |
| 2024 | $3,887 | $151,800 | $32,720 | $119,080 |
| 2023 | $3,437 | $149,320 | $32,080 | $117,240 |
| 2022 | $3,403 | $126,920 | $29,240 | $97,680 |
| 2021 | $2,874 | $104,400 | $13,560 | $90,840 |
| 2020 | $2,824 | $99,640 | $13,560 | $86,080 |
| 2019 | $2,758 | $96,400 | $17,360 | $79,040 |
| 2018 | $2,503 | $84,280 | $10,640 | $73,640 |
| 2017 | $2,268 | $77,120 | $11,600 | $65,520 |
| 2016 | $1,960 | $67,360 | $11,600 | $55,760 |
| 2015 | $1,539 | $51,643 | $10,040 | $41,603 |
| 2014 | $1,539 | $51,643 | $10,040 | $41,603 |
Source: Public Records
Map
Nearby Homes
- 5007 Chastain Way
- 5321 Shadow Walk Way
- 3792 Tanners Mill Rd
- 4880 Sherman Allen Rd
- 4745 Shady Lake Cir
- 5322 Windridge Pkwy Unit 18A
- 5326 Windridge Pkwy Unit 19A
- 5326 Windridge Pkwy
- 5339 Milford Dr Unit 205A
- 5339 Milford Dr
- 5330 Windridge Pkwy Unit 20A
- 5334 Windridge Pkwy
- 5330 Windridge Pkwy
- 5334 Windridge Pkwy Unit 21A
- 5252 Baymont Dr Unit 30A
- 5259 Baymont Dr Unit 159A
- 5263 Baymont Dr Unit 158A
- 5248 Baymont Dr Unit 29A
- 5251 Baymont Dr Unit 161A
- 5259 Baymont Dr
- 5323 Chastain Way
- 5327 Chastain Way
- 5319 Chastain Way
- 5315 Chastain Way
- 5324 Chastain Way
- 5320 Chastain Way
- 5330 Chastain Way
- 5311 Chastain Way
- 5316 Chastain Way
- 5426 Woodstream Ct
- 5337 Chastain Way
- 5312 Chastain Way Unit 111
- 5312 Chastain Way
- 5307 Chastain Way
- 5336 Chastain Way
- 5308 Chastain Way
- 5301 Chastain Way
- 5422 Woodstream Ct
- 5241 Red Hawk Dr
- 5418 Woodstream Ct