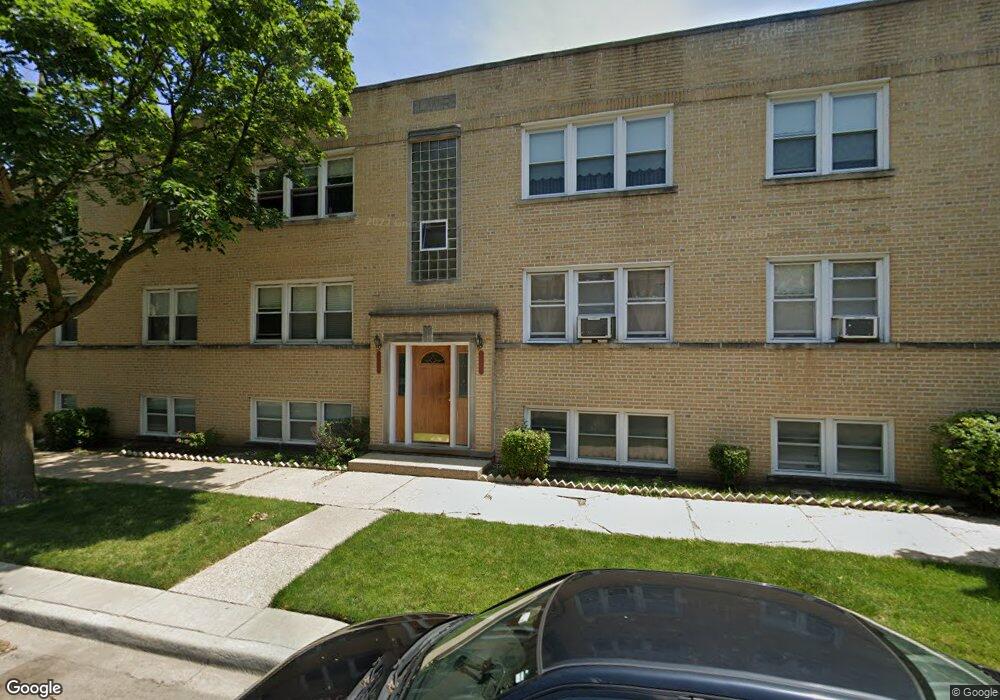
5323 N Rockwell St Unit 202 Chicago, IL 60625
Lincoln Square NeighborhoodEstimated Value: $208,000 - $241,757
3
Beds
1
Bath
1,200
Sq Ft
$193/Sq Ft
Est. Value
About This Home
This home is located at 5323 N Rockwell St Unit 202, Chicago, IL 60625 and is currently estimated at $231,189, approximately $192 per square foot. 5323 N Rockwell St Unit 202 is a home located in Cook County with nearby schools including Budlong Elementary School, Amundsen High School, and North Shore Adventist Academy.
Ownership History
Date
Name
Owned For
Owner Type
Purchase Details
Closed on
Jan 31, 2012
Sold by
Community Savings Bank
Bought by
Kou To Wa Peng
Current Estimated Value
Purchase Details
Closed on
Nov 29, 2011
Sold by
Kokotovic Sulejman and Case #11 Ch 02602
Bought by
Community Savings Bank
Purchase Details
Closed on
Jan 15, 2001
Sold by
Singhvirk Sukhvinder and Kaur Narvinder
Bought by
Kokotovic Sulejman and Kokotovic Nurija
Home Financials for this Owner
Home Financials are based on the most recent Mortgage that was taken out on this home.
Original Mortgage
$122,400
Interest Rate
7.58%
Purchase Details
Closed on
Sep 20, 1999
Sold by
Hasan Syed and Hasan Shirin
Bought by
Kaur Narvinder
Home Financials for this Owner
Home Financials are based on the most recent Mortgage that was taken out on this home.
Original Mortgage
$83,200
Interest Rate
7.87%
Purchase Details
Closed on
Nov 25, 1996
Sold by
Harris Bank Illinois
Bought by
Hasan Syed and Hasan Shirin
Home Financials for this Owner
Home Financials are based on the most recent Mortgage that was taken out on this home.
Original Mortgage
$82,650
Interest Rate
7.91%
Create a Home Valuation Report for This Property
The Home Valuation Report is an in-depth analysis detailing your home's value as well as a comparison with similar homes in the area
Home Values in the Area
Average Home Value in this Area
Purchase History
| Date | Buyer | Sale Price | Title Company |
|---|---|---|---|
| Kou To Wa Peng | $80,000 | Cst | |
| Community Savings Bank | -- | None Available | |
| Kokotovic Sulejman | $153,000 | -- | |
| Kaur Narvinder | $104,000 | -- | |
| Hasan Syed | $87,000 | -- |
Source: Public Records
Mortgage History
| Date | Status | Borrower | Loan Amount |
|---|---|---|---|
| Previous Owner | Kokotovic Sulejman | $122,400 | |
| Previous Owner | Kaur Narvinder | $83,200 | |
| Previous Owner | Hasan Syed | $82,650 |
Source: Public Records
Tax History Compared to Growth
Tax History
| Year | Tax Paid | Tax Assessment Tax Assessment Total Assessment is a certain percentage of the fair market value that is determined by local assessors to be the total taxable value of land and additions on the property. | Land | Improvement |
|---|---|---|---|---|
| 2024 | $3,165 | $16,623 | $4,608 | $12,015 |
| 2023 | $3,085 | $15,000 | $3,733 | $11,267 |
| 2022 | $3,085 | $15,000 | $3,733 | $11,267 |
| 2021 | $3,016 | $14,999 | $3,733 | $11,266 |
| 2020 | $3,313 | $14,871 | $2,216 | $12,655 |
| 2019 | $3,325 | $16,550 | $2,216 | $14,334 |
| 2018 | $3,269 | $16,550 | $2,216 | $14,334 |
| 2017 | $4,188 | $19,453 | $1,983 | $17,470 |
| 2016 | $3,896 | $19,453 | $1,983 | $17,470 |
| 2015 | $3,565 | $19,453 | $1,983 | $17,470 |
| 2014 | $2,995 | $16,143 | $1,749 | $14,394 |
| 2013 | $2,458 | $16,143 | $1,749 | $14,394 |
Source: Public Records
Map
Nearby Homes
- 2531 W Berwyn Ave Unit G
- 5300 N Lincoln Ave Unit 4E
- 5250 N Lincoln Ave Unit 3C
- 5220 N Rockwell St Unit 1S
- 2710 W Summerdale Ave Unit GA
- 2521 W Farragut Ave
- 2700 W Balmoral Ave
- 2712 W Balmoral Ave Unit 2E
- 5230 N Campbell Ave Unit 1B
- 2601 W Foster Ave Unit 3S
- 2637 W Catalpa Ave
- 2745 W Berwyn Ave
- 2434 W Farragut Ave Unit 3B
- 2422 W Berwyn Ave Unit 309
- 2409 W Balmoral Ave Unit 3D
- 2620 W Catalpa Ave Unit 1A
- 2626 W Catalpa Ave Unit 21
- 2411 W Balmoral Ave Unit 1F
- 2463 W Foster Ave Unit 3
- 2420 W Farragut Ave Unit 3A
- 5323 N Rockwell St Unit GS
- 5323 N Rockwell St Unit 2N
- 5323 N Rockwell St Unit 302
- 5323 N Rockwell St Unit 201
- 5323 N Rockwell St Unit 301
- 5323 N Rockwell St Unit 102
- 5323 N Rockwell St Unit Room 1
- 5323 N Rockwell St Unit Room 2
- 5323 N Rockwell St Unit 1N
- 2553 W Summerdale Ave Unit 2W
- 2553 W Summerdale Ave Unit 1W
- 2553 W Summerdale Ave Unit 1E
- 2549 W Summerdale Ave
- 2549 W Summerdale Ave
- 2601 W Summerdale Ave
- 2601 W Summerdale Ave
- 2601 W Summerdale Ave Unit 2
- 2601 W Summerdale Ave
- 2601 W Summerdale Ave
- 2605 W Summerdale Ave Unit G05C