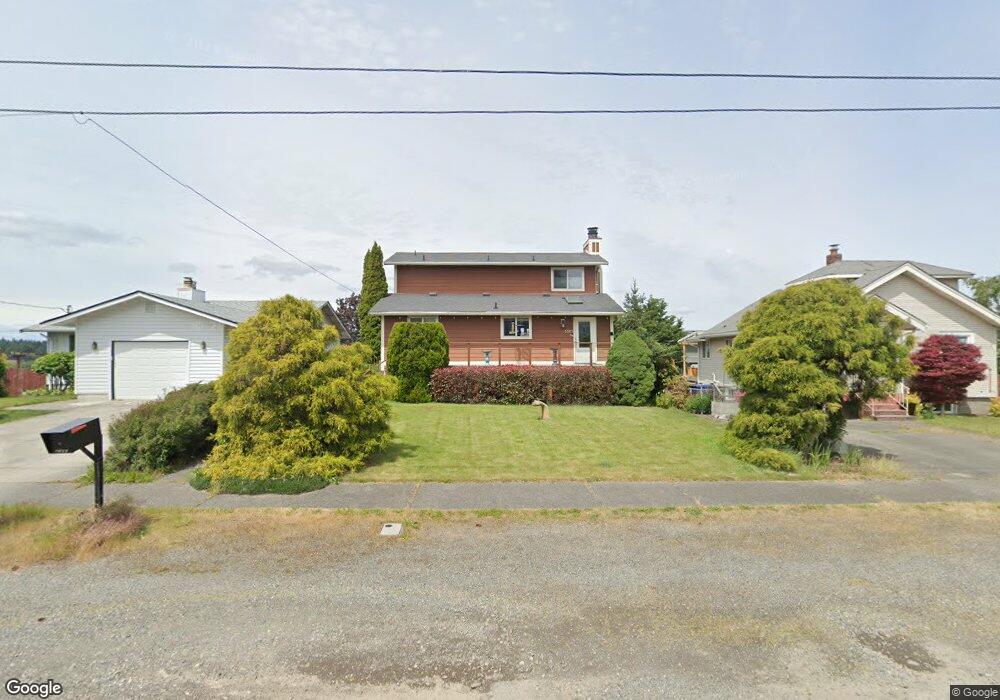
5323 N Ruby St Tacoma, WA 98407
Estimated Value: $815,000 - $904,000
4
Beds
2
Baths
2,100
Sq Ft
$409/Sq Ft
Est. Value
About This Home
This home is located at 5323 N Ruby St, Tacoma, WA 98407 and is currently estimated at $858,003, approximately $408 per square foot. 5323 N Ruby St is a home located in Pierce County with nearby schools including Point Defiance Elementary School, Truman Middle School, and Dr. Dolores Silas High School.
Ownership History
Date
Name
Owned For
Owner Type
Purchase Details
Closed on
Mar 7, 2011
Sold by
Fincham Berlie and Fincham Beverly
Bought by
Tomal Jerry S
Current Estimated Value
Home Financials for this Owner
Home Financials are based on the most recent Mortgage that was taken out on this home.
Original Mortgage
$307,014
Outstanding Balance
$210,551
Interest Rate
4.75%
Mortgage Type
FHA
Estimated Equity
$647,452
Purchase Details
Closed on
Aug 28, 2007
Sold by
Stills Andrew L and Stills Elda S
Bought by
Fincham Berlie
Home Financials for this Owner
Home Financials are based on the most recent Mortgage that was taken out on this home.
Original Mortgage
$374,400
Interest Rate
6.74%
Mortgage Type
Purchase Money Mortgage
Purchase Details
Closed on
Jul 6, 2005
Sold by
Keel Lewis C
Bought by
Stills Andrew L and Stills Elda S
Home Financials for this Owner
Home Financials are based on the most recent Mortgage that was taken out on this home.
Original Mortgage
$260,000
Interest Rate
5.58%
Mortgage Type
Fannie Mae Freddie Mac
Create a Home Valuation Report for This Property
The Home Valuation Report is an in-depth analysis detailing your home's value as well as a comparison with similar homes in the area
Home Values in the Area
Average Home Value in this Area
Purchase History
| Date | Buyer | Sale Price | Title Company |
|---|---|---|---|
| Tomal Jerry S | $315,000 | Fidelity National Title | |
| Fincham Berlie | $468,000 | The Talon Group | |
| Stills Andrew L | $325,000 | Ticor |
Source: Public Records
Mortgage History
| Date | Status | Borrower | Loan Amount |
|---|---|---|---|
| Open | Tomal Jerry S | $307,014 | |
| Previous Owner | Fincham Berlie | $374,400 | |
| Previous Owner | Stills Andrew L | $260,000 |
Source: Public Records
Tax History
| Year | Tax Paid | Tax Assessment Tax Assessment Total Assessment is a certain percentage of the fair market value that is determined by local assessors to be the total taxable value of land and additions on the property. | Land | Improvement |
|---|---|---|---|---|
| 2025 | $8,432 | $825,100 | $428,400 | $396,700 |
| 2024 | $8,432 | $793,700 | $413,500 | $380,200 |
| 2023 | $8,432 | $758,100 | $358,700 | $399,400 |
| 2022 | $7,904 | $822,900 | $417,000 | $405,900 |
| 2021 | $7,359 | $586,100 | $265,500 | $320,600 |
| 2019 | $6,515 | $542,500 | $224,100 | $318,400 |
| 2018 | $7,023 | $501,800 | $202,000 | $299,800 |
| 2017 | $6,168 | $445,000 | $151,500 | $293,500 |
| 2016 | $5,498 | $336,800 | $114,500 | $222,300 |
| 2014 | $4,847 | $316,500 | $110,100 | $206,400 |
| 2013 | $4,847 | $292,300 | $98,600 | $193,700 |
Source: Public Records
Map
Nearby Homes
- 5302 N 49th St
- 5321 N 48th St
- 5334 N Commercial St
- 5301 N Commercial St
- 5348 N 47th St
- 4908 N Winnifred St
- 4818 N Ferdinand St
- 5108 N 46th St Unit 5110
- 4945 N Pearl St
- 5217 N Winnifred St
- 4961 Main St Unit 211
- 4961 Main St Unit 517
- 5105 Grand Loop Unit 402
- 5105 Grand Loop Unit 410
- 5003 Main St Unit 108
- 4907 Main St Unit 524
- 4907 Main St Unit 702
- 4907 Main St Unit 521
- 4636 N Gove St
- 4301 N Orchard St
- 5317 N Ruby St
- 5325 N Ruby St
- 5315 N Ruby St
- 5329 N Ruby St
- 5318 N 49th St
- 5316 N 49th St
- 5309 N Ruby St
- 5320 N 49th St
- 5312 N 49th St
- 5335 N Ruby St
- 5326 N Ruby St
- 5330 N Ruby St
- 5320 N Ruby St
- 5301 N Ruby St
- 5404 N 49th St
- 5334 N Ruby St
- 5316 N Ruby St
- 53 XX N 49th St
- 53 N 49th St
- 0 N Undisclosed Unit 1575142
Your Personal Tour Guide
Ask me questions while you tour the home.